“You will be full of camel-trains, even the young camels of Midian and Ephah; all from Sheba will come, with gold and spices, giving word of the great acts of the Lord.”
Isaiah 60:6 (BBE)
“Riding on David Lean’s train gives us a brief romance in the UK, an adventure in Arabia, a revolution in Russia and a glimpse of the River Kwai in Burma.”
Author
Discover the purpose of your work and your corporation
What is your purpose in work?
- You can help to facilitate the movement of the local population at an affordable fare.
- Your investment in the mass transit rail projects will spur the economy in the region and provide job opportunities.
What drives your corporation’s core value?
- Provide the basic interconnectivity and platforms for economic growth and social benefits to the developing nations.
- Generate a stable and long-term income for the company.

1.0 Executive Summary
Mission
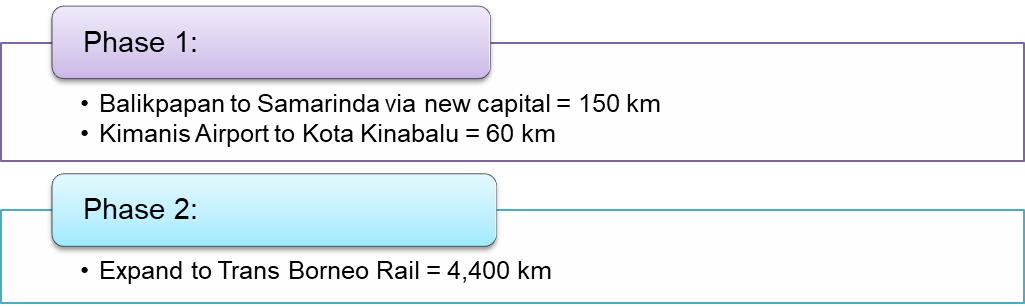
Phase 1: 	Balikpapan to Samarinda via new capital = 150 km
	                 Kimanis Airport to Kota Kinabalu = 60 km
Phase 2: 	Expand to Trans Borneo Rail = 4,400 km
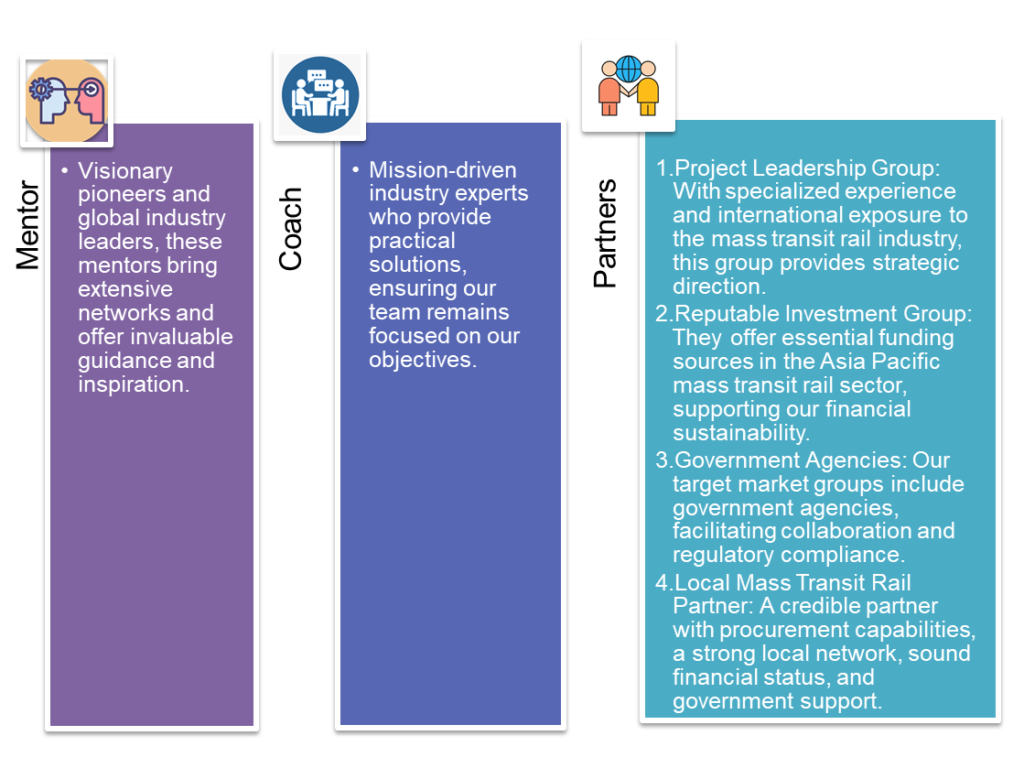
Key Management Team
Mentors:
- Visionary pioneers and global industry leaders, these mentors bring extensive networks and offer invaluable guidance and inspiration.
Coaches:
- Mission-driven industry experts who provide practical solutions, ensuring the team remains focused on the objectives.
Partners:
- Project Leadership Group: With specialized experience and international exposure to the mass transit rail industry, this group provides strategic direction.
- Reputable Investment Group: They offer essential funding sources in the Asia Pacific mass transit rail sector, supporting the financial sustainability.
- Government Agencies: The target market groups include government agencies, facilitating collaboration and regulatory compliance.
- Local Mass Transit Rail Partner: A credible partner with procurement capabilities, a strong local network, sound financial status, and government support.
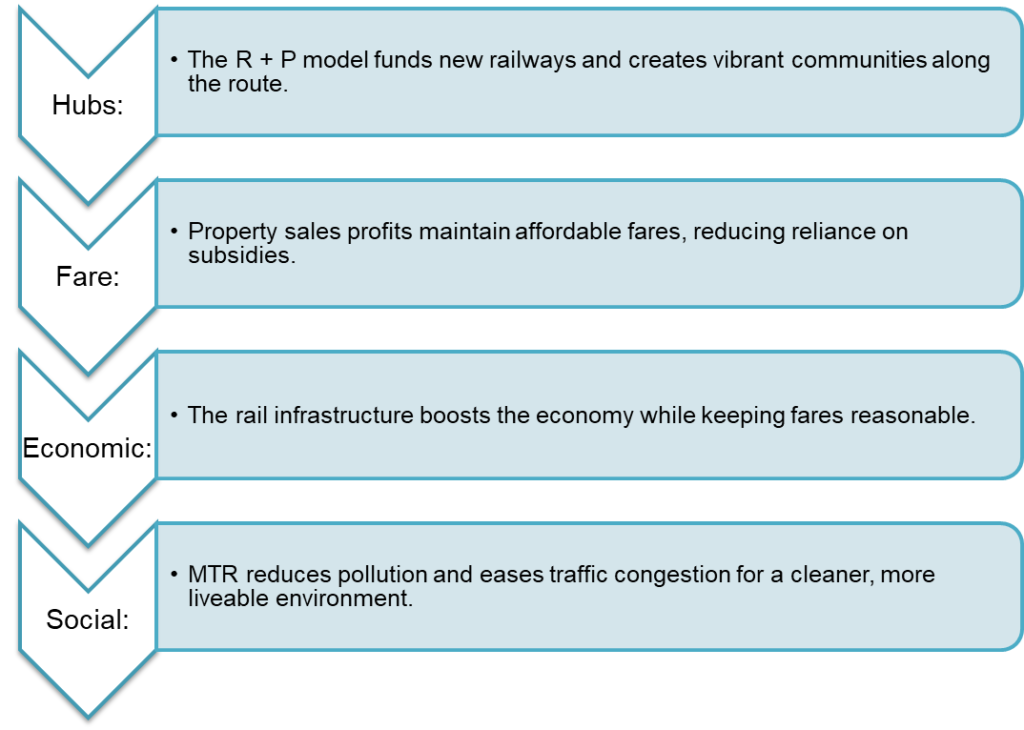
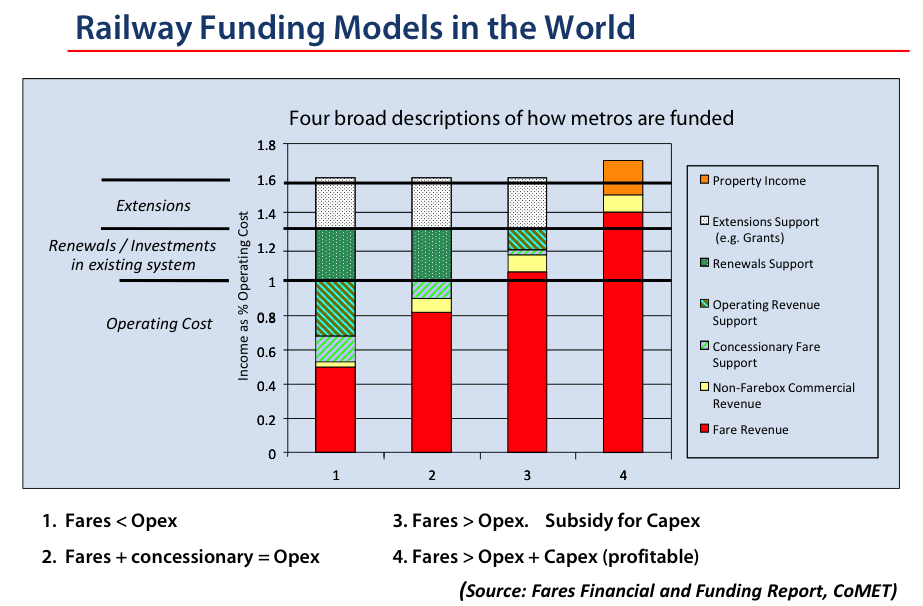
Product Benefits
- Hubs: The R + P model funds new railways and creates vibrant communities along the route.
- Fare: Property sales profits maintain affordable fares, reducing reliance on subsidies.
- Economic: The rail infrastructure boosts the economy while keeping fares reasonable.
- Social: MTR reduces pollution and eases traffic congestion for a cleaner, more livable environment.
Target Market
- Segment: The primary focus is on mass transit railway infrastructure construction, including Kota Kinabalu, Samarinda, Balikpapan, and Indonesia’s new capital.
- Customers: Key customers include Borneo government agencies.
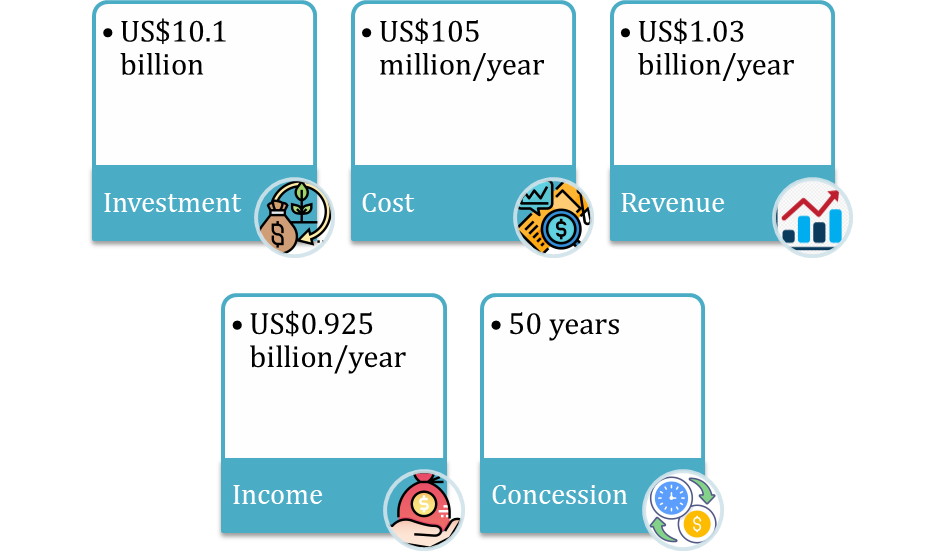
Financial Projections
- Investment: US$10.1 billion (Phase 1)
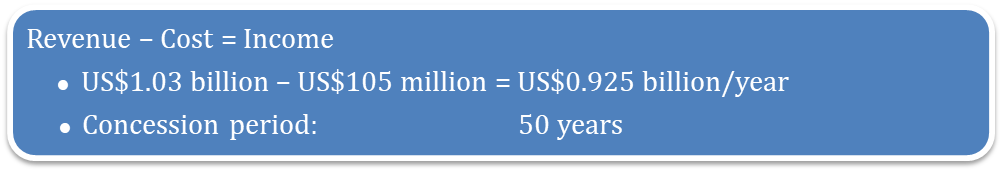
- Cost: US$105 million/year
- Revenue: US$1.03 billion/year
- Income: US$0.925 billion/year
- Concession: 50 years
Unique Business Model
- PPP: The innovative approach involves a Public-Private Partnership (PPP) model.
- Team: We’ve partnered with a top global mass transit rail consortium.
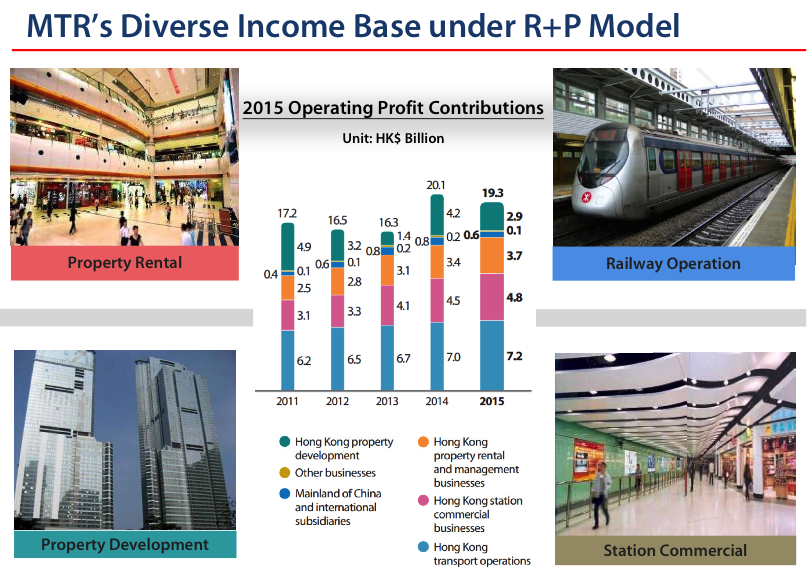
- R & P: Utilizing a unique Rail plus Property (R & P) model, inspired by the successful Hong Kong MTR.
- Value: This model enhances the land value near stations, with property development profits helping finance the investment.
- Funding: Private sector funding alleviates the burden on the state budget.
- Fare: Commuters enjoy lower fares as a direct benefit.
- Return: Investors gain the confidence of a stable and long-term financial return.
2.0 Mission
2.1 Problem
Borneo lacks modern rail projects to connect its urban population centres.
2.2 Solution
- PPP: The successful Private-Public Partnership model.
- R+P: Leveraging the Mass Transit Rail (MTR) with a Rail + Property (R+P) strategy, blending commercial principles with social benefits.
2.3 Mission
- Phase 1: Connect Balikpapan to Samarinda via the new capital (150 km) with an estimated cost of US$7.2 billion.
- Establish a rail link from Kimanis Airport to Kota Kinabalu (60 km) with an estimated cost of US$2.9 billion.
- Phase 2: Expand to the Trans Borneo Rail, encompassing a massive 4,400 km network.
3.0 Product
3.1 Product Description
- Balikpapan to Samarinda via the new capital: Designed for a future population of 12 million.
- Kimanis International Airport to Kota Kinabalu: Serving an estimated 20 million by 2050.
- Investors develop stations and adjacent commercial-residential hubs.
- “Rail plus property model” ensures affordable fares with property development income.
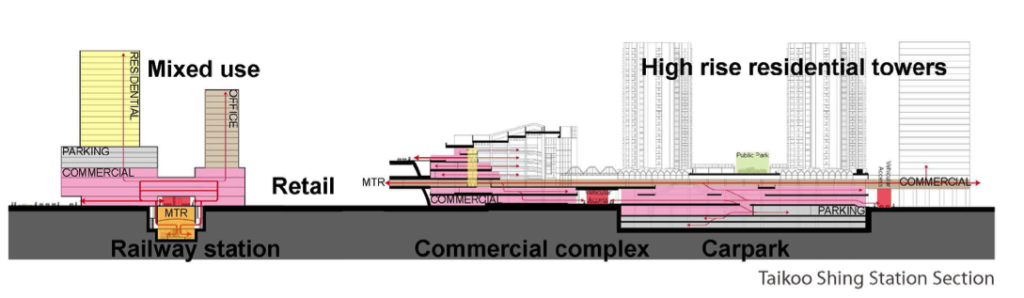
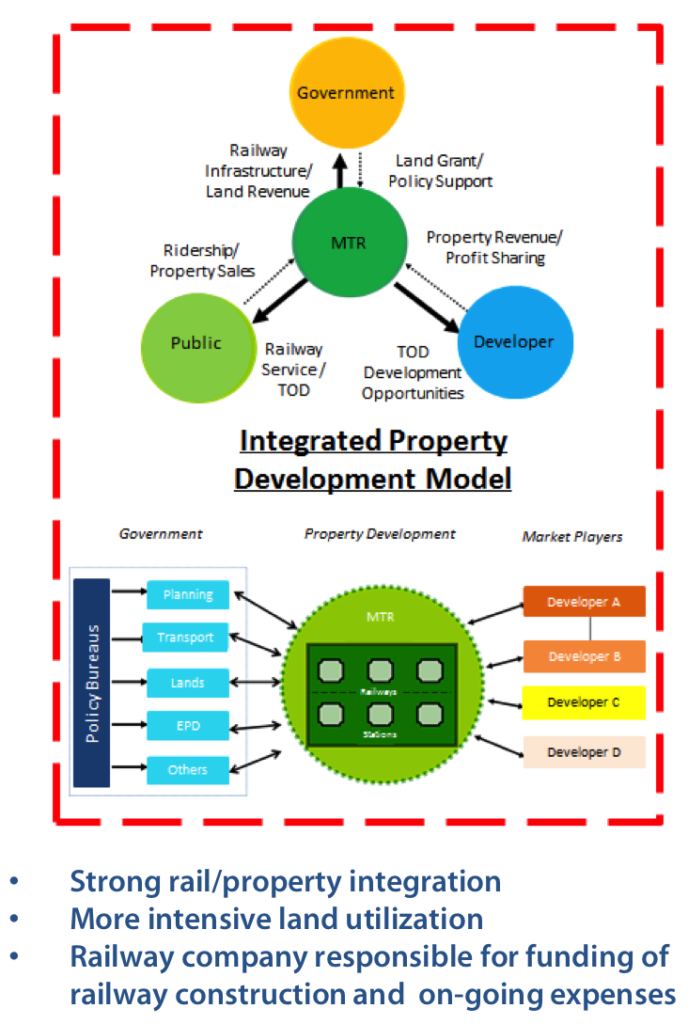
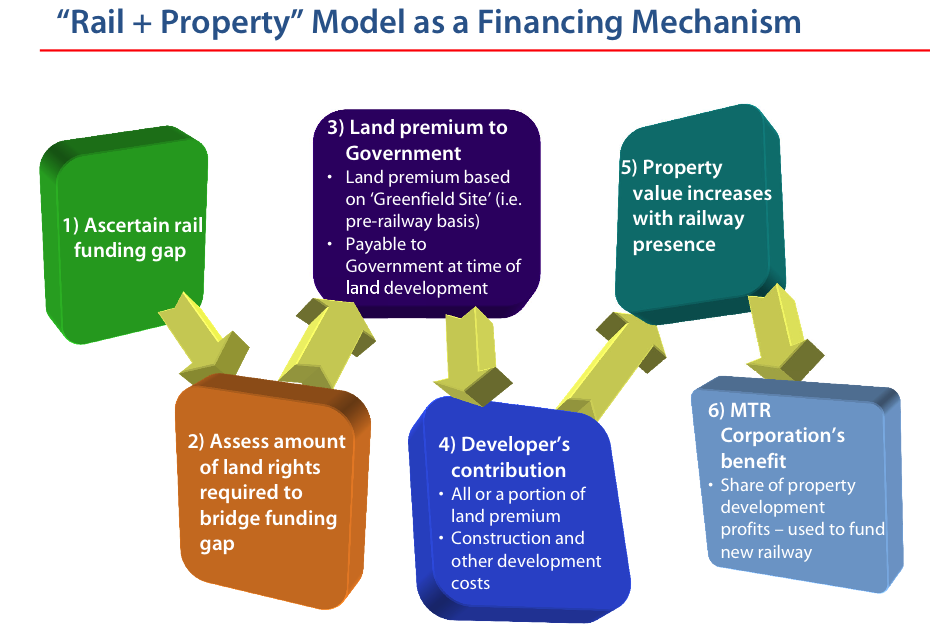
Hong Kong MTR – Rail + Property Model
3.2 Product Attributes
- Funding: Private investors will finance Value Capture railway projects, emphasizing the rail+property model.
- Rights: Government provides special development rights in land grants at reduced costs.
- Property: The rail company leverages its stations’ real estate development potential, generating revenue by selling development rights to private developers.
- Land: The rail company receives prepayment for development rights, offsetting railway investment costs.
- Asset: After the agreed concession period, the government takes ownership of the railway land title.
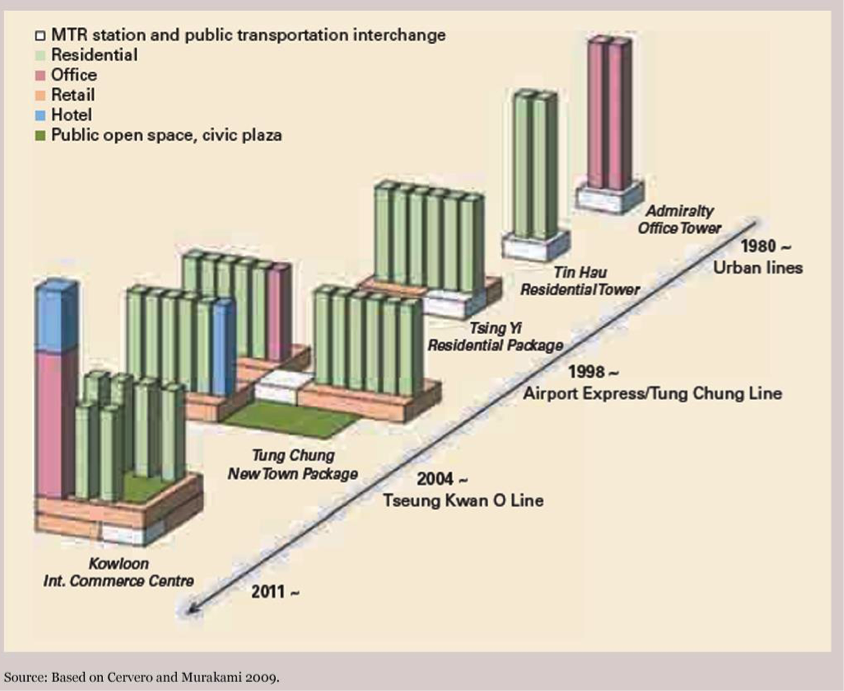
- Evolution: The “R + P Model” transforms into a thriving, mixed-use community over time.
Evolution into mixed-use functions: Case Study Hong Kong Mass Transit Rail Corporation
3.3 Product Benefits
- Hubs: The R+P development model funds new railway lines and creates vibrant, integrated commercial and residential communities along the railway route.
- Fare: Profits from property sales enable us to maintain affordable fares without relying on government subsidies.
- Economic: The mass transit rail infrastructure drives economic growth while ensuring affordability for passengers.
- Social: The Mass Transit Rail (MTR) system contributes to reducing motor vehicle pollution and alleviating traffic congestion, echoing the wisdom of Lewis Mumford: “Adding car lanes to deal with traffic congestion is like loosening your belt to cure obesity.” (1955).
3.4 Product Competitive Advantages
- Funding: The land value capture model significantly enhances land and real estate value, allowing the captured value to repay infrastructure costs effectively.
- Value: Demonstrated by the Hong Kong example, property price premiums of 5%-17% for apartments near railway stations underscore the added value the projects bring to real estate.
- PPP: The effective partnership model involving government, private investors, and a well-established rail operator is a key driver of the project’s success.
4.0 Market
4.1 Market Segment
Phase 1:
- Kimanis New International Airport to Kota Kinabalu: 60 km
- Samarinda-Balikpapan via the New capital of Indonesia: 150 km
Phase 2: Trans Borneo Railway:
- In 2013, the Brunei-Indonesia-Malaysia-Philippines East Asean Growth Area (BIMP-EAGA) proposed the US$16.3 billion, 4,440-kilometer Trans-Borneo Railway project, connecting Brunei, Sabah, Sarawak, and Kalimantan around the Borneo Island.
- In 2017, the Sabah Government approved extending the railway network coverage to the entire state, forming part of the Trans-Borneo Railway.
4.2 Target Market Strategy
- Growth: The Borneo railway strategy is centred on areas with increasing population density, ensuring critical mass for project financial viability.
- Job: Prioritise cities with rapid migration due to new job opportunities, aligning the plans with areas of job growth.
- Model: Investment in the rail+property program enhances cost competitiveness and overall project appeal.
- Revenue: The focus is on generating a consistent and stable long-term income through value capture rail projects.
4.3 Market Needs
Kalimantan: The government’s plan to construct 2,428 kilometers of rail from North to South Kalimantan, along with the connection of West Kalimantan to Central Kalimantan, highlights the pressing need for improved railway infrastructure in the region.
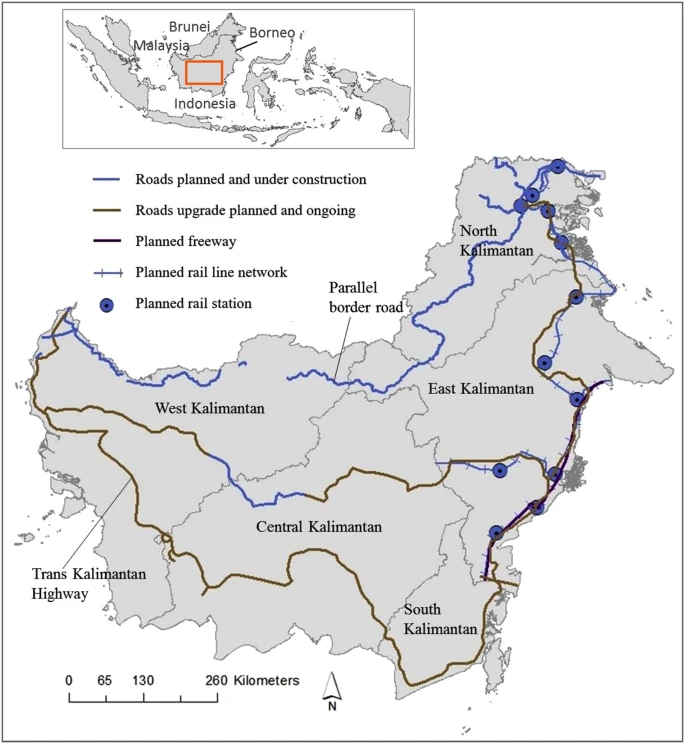
The Trans-Kalimantan rail network proposal includes:
- Banjarmasin- Palangkaraya line: 230 km
- Banjarmasin-Tanjung line: 200 km
- Tanjung-Samarinda line: 300 km
- Balikpapan-Samarinda line: 89 km
- Batas Negara-Tanjung Redep: 279 km
- Tanjung Redep-Lubuktutung: 293 km
- Sanggau-Palangkaraya: 587 km
- Sanggau-Pontianak: 143 km
- Pontianak-Batas Negara: 268 km
4.4 Growth Drivers
- Population: The increasing population growth in Borneo’s metropolitan cities is a significant driver for our railway projects.
- Urbanization: Rapid urbanization, coupled with job prospects in major cities, fuels the demand for improved transportation infrastructure.
- Green: The adoption of environmentally friendly and competitive transportation solutions aligns with emerging market trends, contributing to our growth.
4.5 Key Customers
Mass Transit Rail:
- Kementerian Perhubungan (Ministry of Transportation), PT Kereta Api Indonesia: Key player in Indonesia’s transportation sector.
- Jabatan Keretapi Negeri Sabah (Ministry of Infrastructure Development), Sabah State Rail: Critical for rail projects in the Sabah region.
4.6 Competition and Industry
Key players in the mass transit rail industry include:
     •	Bangkok MRT
     •	Beijing MTR
     •	BNSF Railway
     •	Canadian National Railway
     •	Central Japan Railway
     •	CSX
     •	Deutsche Bahn
     •	East Japan Railway
     •	Guangzhou Metro
     •	Hong Kong MTR
     •	Indian Railways
     •	Indonesia (Angkasa Oura II, Kereta Api Indonesia, Kereta Cepat-China,
                Indonesia MRT Jakarta, LRT Jakarta)
     •	Malaysia (Express Rail Link, KTM, Rapid Rail)
     •	Mexico City Metro
     •	Moscow Metro
     •	New York Subway
     •	Paris Metro
     •	Russian Railways
     •	Shanghai Metro
     •	Seoul Metropolitan Subway
     •	Singapore SMRT
     •	SNCF
     •	Toei Subway
     •	Tokyo Metro
     •	Union Pacific
5.0 Operation
5.1 Project procurement: Flow chart for PPP project
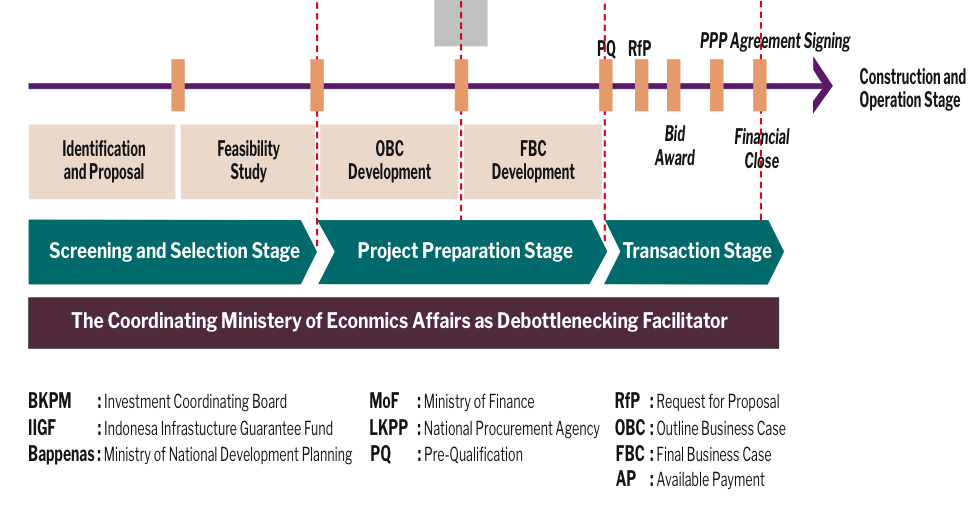
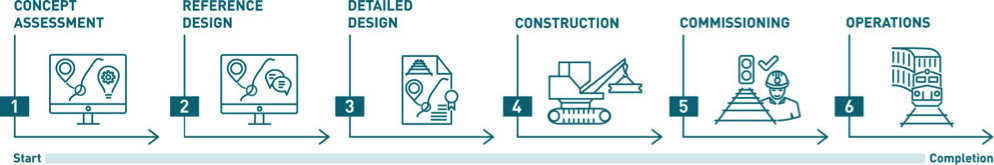
5.2 Mass Transit Rail Project Stages
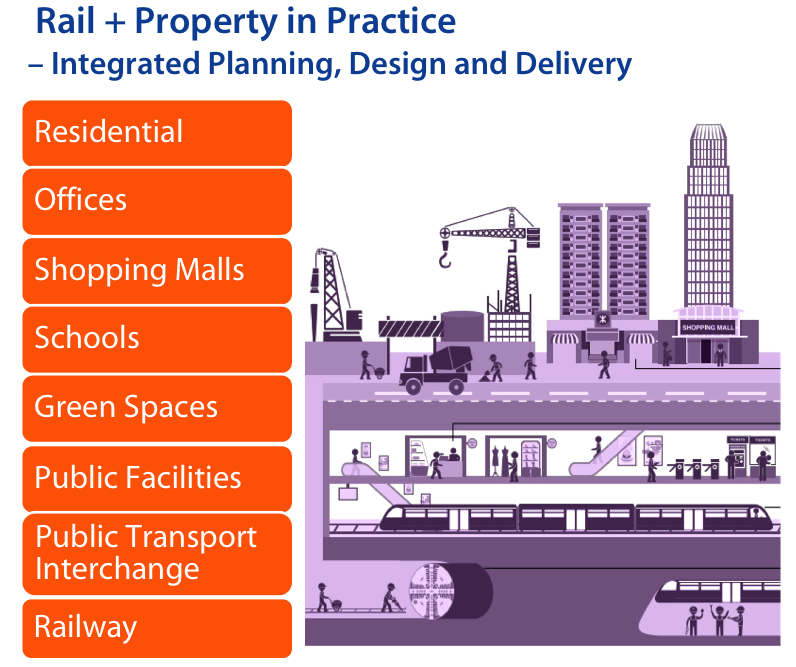
5.3 Integrated Rail + Property Development Model
5.4 MTR Development Design Example
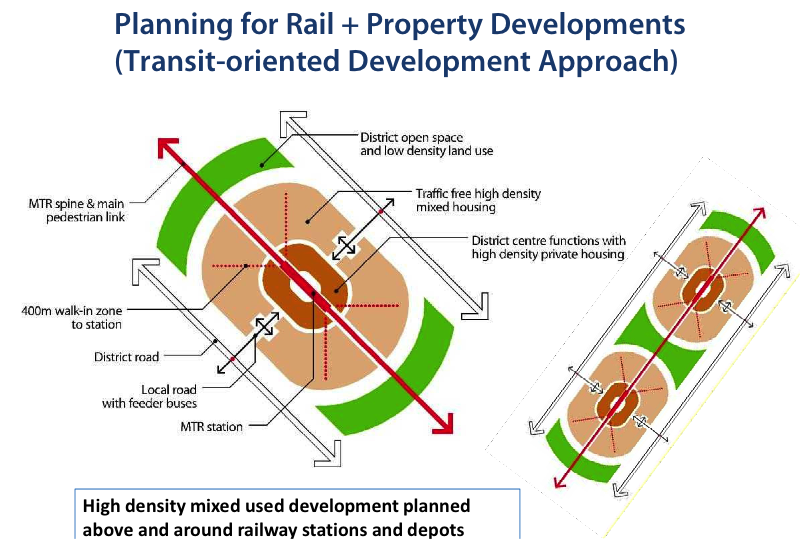
5.5 Mixed development–value creation to community
6.0 Financial Implications
6.1 Investment Segments
1. Phase 1 Mass Transit Rail:
           Balikpapan to Samarinda via new capital
           150 km X US$47.7 million/km = 	US$7.2 billion
           Kimanis to Kota Kinabalu
           60 km X US$47.7 million/km =         US$2.9 billion
           Total: 					                         US$10.1 billion
2. The “Rail + Property” model investment cost from local property developers:
New Capital: 		50 stations X 30,000 residential units
Samarinda: 		10 stations X 30,000 residential units
Balikpapan: 		10 stations X 30,000 residential units
Kota Kinabalu:       10 stations X 30,000 residential units
Total: 			         80 stations X 30,000 residential units = 2.4 million units
Investment: US$10.1 billion / 2.4 million units = US$4,200/unit
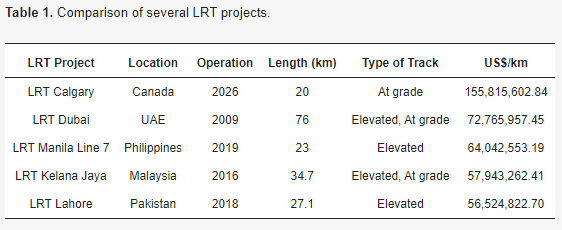
Case Studies:
1. LRT Investment Comparison
2. Jakarta-Bandung High-Speed Railway Project
- Track Length: 142.30 kilometers
- Project Value: US$5.5 billion
- Cost per kilometer: US$38.7 million/km
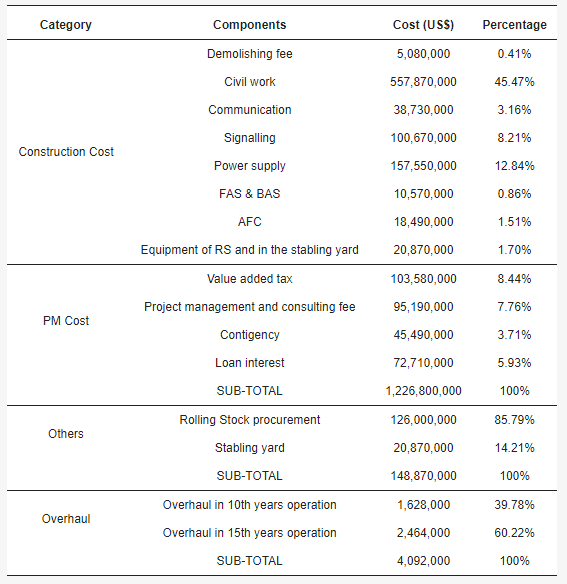
3. Greater Jakarta LRT
- Track Length: 44.3 kilometers
- Project Value: US$2.11 billion
- Cost per kilometer: US$47.73 million/km
Components of cost Greater Jakarta Light Rail Transit (LRT)
6.2 Production Cost
Annual operation and maintenance cost: US$0.50 million/km/year
Phase 1: 210 km X US$0.5 million = US$105 million/year
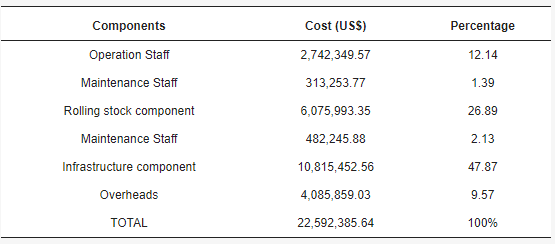
Case study:
Greater Jakarta LRT–annual cost in operation and maintenance stage
6.3 Prices and Revenues
Phase 1:
Passengers/day:
Samarinda-New Capital-Balikpapan = 12 million X 30% = 3.6 million
Kimanis-Kota Kinabalu = 3 million X 30% =                                  0.9 million
Total = 								                                                  4.5 million/day
Income:
Fare:                        US$0.05/km
Transport:            4.5 million X US$0.05/km X 5 km =   US$1.124 million (40%)
Non-farebox:     Commercial + Properties + Rental = US$1.686 million (60%)
Daily revenue:   Daily income =                                                US$2.81 million (100%)
Yearly revenue: US$2.81 million X 365 days =                US$1.03 billion/year
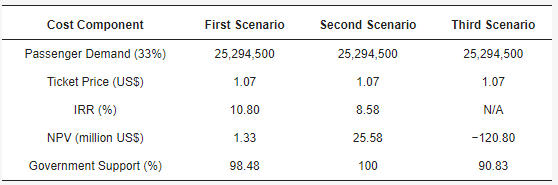
Case Studies:
1. Greater Jakarta LRT
Ticket: 		US$1.07 (33% occupancy initially)
Non-farebox: 	10% of total farebox
                         	Non-farebox includes advertisement, retail and commercial
                                revenues.
2. Hong Kong MTR 2015
3. Hong Kong MTR 2018
Transport:       CAGR of 6.0% in revenues, growth from US$1.5 billion in 2009 to US$2.5
 				billion.
Commercial: CAGR of 10.0% in revenues, increase from US$352 million in 2009 to
				US$830 million.
Property:         Increased by a CAGR of 7.5% for the last 10 years, rising from US$338
				million in 2009 to US$649 million in 2018.
Group:               MTR has achieved a CAGR of 12.4% and 4.9% in group revenue and
                                profits for the last 10 years.
ROE:                   A 10-Year Return on Equity average 6.68% per annum.
Source: Hong Kong MTR Annual report 2018
6.4 Financial Returns
Case studies:
Case 1: Jakarta MRT
- Length: 15.7 km
- Estimated Cost: $1.5 billion
- ROI (Return on Investment): 4.16-9.63%
Case 2: LRT Semarang
- Length: 70.3 km
- Estimated Cost: $1.041 billion
- FIRR (Financial Internal Rate of Return): 11.86%
- Concession Period: 50 Years
Case 3: LRT Medan
- Length: 17.4 km
- Estimated Cost: $824.8 million
- EIRR (Economic Internal Rate of Return): 15.05%
- Concession Period: 34 Years
Case 4: Greater Jakarta LRT
Case 5: KCRC MOS Rail and TST Extension

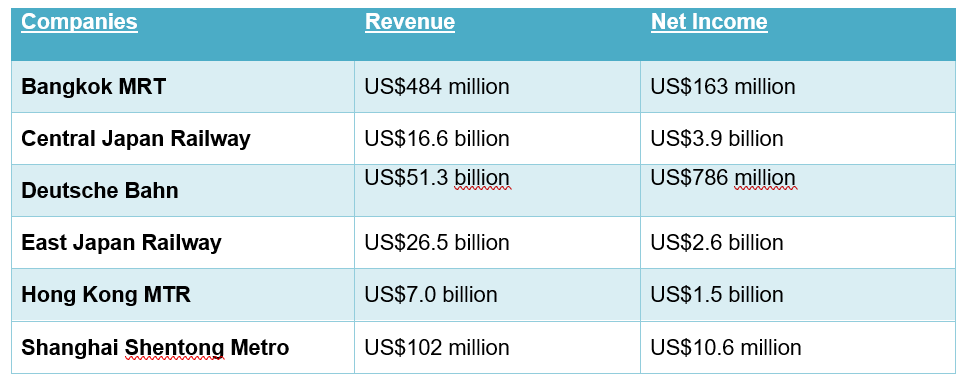
2019 Financial Income of listed mass transit rail companies.
6.5 Source of Funding
1. Strategic Investors
- New Investors: Comprising the project leadership team with a strong business and financial focus.
- Financiers: MTR private equity and investor groups.
- MTR Group: Involving international MTR developers, builders, and operators.
- Target Market: Focused on financing projects such as Samarinda–Balikpapan via Indonesia New Capital in Kalimantan and Kimanis New Airport to Kota Kinabalu in Sabah.
2. Private Equities and Investors
     •	4D Infrastructure
     •	abrdn
     •	Actis
     •	Aegon Asset Management
     •	Alinda Capital Partners
     •	Allianz Capital Partners
      •	Amber Infrastructure Group
     •	AMP Capital
     •	Antin Infrastructure Partners
     •	APG Asset Management
     •	ARC Infrastructure
     •	Ardian
     •	ASI UK Ethical Equity
     •	Asset Management One
     •	AXA IM Alts
     •	Bain Capital
     •	BlackRock
     •	BNP Paribas Asset Management
     •	Brookfield Asset Management
     •	Carlyle Group
     •	CDB Capital
     •	CDPQ
     •	China Universal Asset Management
     •	CIM Group
     •	CITIC Capital
     •	Clearbridge Investments
     •	Deutsche Bahn Group
     •	Deutsche Bank
     •	DIF Capital Partners
     •	DWS RREEF Infrastructure
     •	Ferrovial
     •	First Sentier
     •	Fortress Investment Group
     •        FundCalibre
     •	Geode Capital Management
     •	Global Infrastructure Group
     •	Goldman Sachs Asset Management
     •	HICL Infrastructure
     •	I Squared Capital
     •	IFM Investors
     •	Infracapital
     •	InfraRed Capital Partners
     •	Indonesia Infrastructure Finance
     •	ING Infrastructure Finance
     •	KKR
     •	Lazard Asset Management
     •	M&G Investments
     •	Macquarie Infrastructure and Real Assets
     •	Mandiri Investasi
     •	MARTA
     •	MEAG
     •	Meridiam Infrastructure
     •	MetLife Investment Management
     •	Montanaro
     •	Nikko Asset Management
     •	Nomura Asset Management
     •	Norges Bank Investment Management
     •	NOVA Infrastructure
     •	Pantheon Ventures

     •	State Street Global Advisors Asia
     •	Sumitomo Mitsui Trust Asset Management
     •	The Infrastructure Fund (TIF)
     •	TIIC
     •	T. Rowe Price
     •	Vanguard Group
     •	Vinci
     •	Vontobel Asset Management
     •	Yielco Investments
3. Consultants, Development, and Fund Managers in the Infrastructure Industry:
     •	ADB (Asian Development Bank)
     •	AFD (Agence Française de Développement)
     •	AIIB (Asian Infrastructure Investment Bank)
     •	BCG (Boston Consulting Group)
     •	CER (Community of European Railway and Infrastructure Companies)
     •	Deloitte
     •	EIB (European Investment Bank)
     •	Ernst & Young
     •        Futue Southeast Asia
     •	IBRD (International Bank for Reconstruction and Development)
     •	International Union of Railways (UIC)
     •	Indonesia Infrastructure Finance (IIF)
     •	IIGF (Indonesia Infrastructure Guarantee Fund)
     •	IMF (International Monetary Fund)
     •	Infrastructure Asia
     •	International Development Finance Corporation (IDFC)
     •	ITF (International Transport Forum)
     •	JICA (Japan International Cooperation Agency)
     •	KfW Group
     •	KPMG
     •	MASKA (Indonesia Railway Society)
     •	McKinsey
     •	PPIAF (Public-Private Infrastructure Advisory Facility)
     •	PWC (PricewaterhouseCoopers)
     •	Sarana Multi Infrastruktur (SMI)
     •	World Bank
6.6 Major Revenue Sources
The primary revenue sources for infrastructure projects are:
- User Pay Charges: Revenue generated from users of the infrastructure, such as tolls, fares, or usage fees, depending on the type of infrastructure (e.g., roads, railways, public transport).
- Property Development: Income generated from real estate development associated with the infrastructure project, often using the “rail plus property” model, where the development potential of land near the infrastructure is capitalized.
- Land Deals: Investment in land deals that yield higher profits through property development, creating a significant upside in revenue generation for the project.
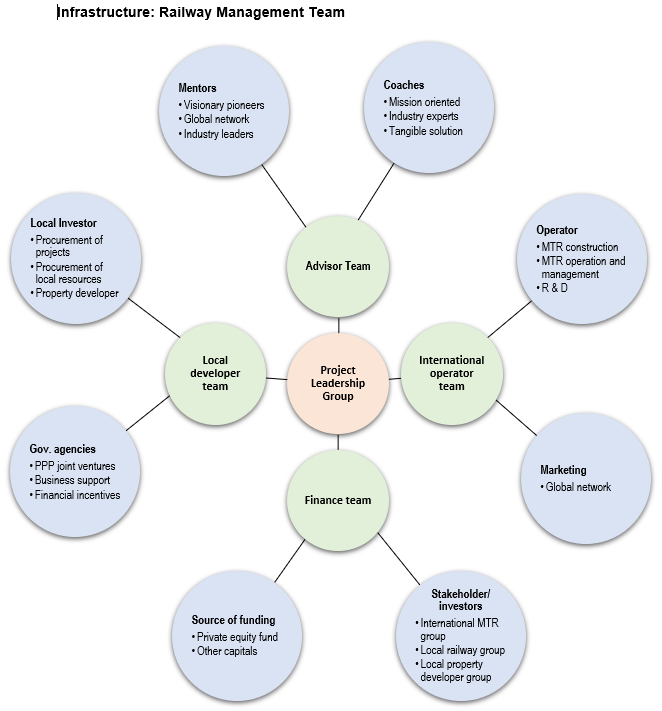
7.0 Management Team
7.1 Key Management Team
- Mentor:
Mentors are visionary pioneers and industry leaders with a vast global network. They provide invaluable guidance and inspiration.
- Coaches:
Coaches are mission-oriented industry experts who offer practical solutions to challenges, ensuring the team stays focused on its objectives.
- Partners:
1. A project leadership group with experience in the specific segment and international exposure to the mass transit rail industry.
2. A reputable investment group with sources of funding in the Asia Pacific mass transit rail industry.
3. Target market groups comprising government agencies.
4. A credible local mass transit rail partner with procurement capabilities, local network, sound financial status and solid support from the government.
In the rail industry, several global leaders have made significant contributions, shaping its growth and success. Here is a list of some of these remarkable individuals, honoured for their vision and dedication:
These are just a few of the outstanding professionals and captains of the industry. The readers are encouraged to explore further and conduct their research to learn more about the management teams in this dynamic field.
7.2 Key Management Team Model
8.0 Unique Business Model
8.1 Successful Track Record
Strategy:
- The Hong Kong MTR Group pioneered the Rail + Property model. They secure property development rights, utilizing revenues to subsidize railway construction, operations, and reinvestment.
Land:
- The operator purchases land, constructs a rail line, builds stations, and develops residential and commercial properties, capitalizing on increased land value due to the new railway.
PPP:
- The Public-Private Partnership format has proven successful for international mass transit rail projects.
8.2 Entry Model
JV Entity:
- Establish a joint venture entity involving international consortiums, local government agencies, and local mass transit rail developers.
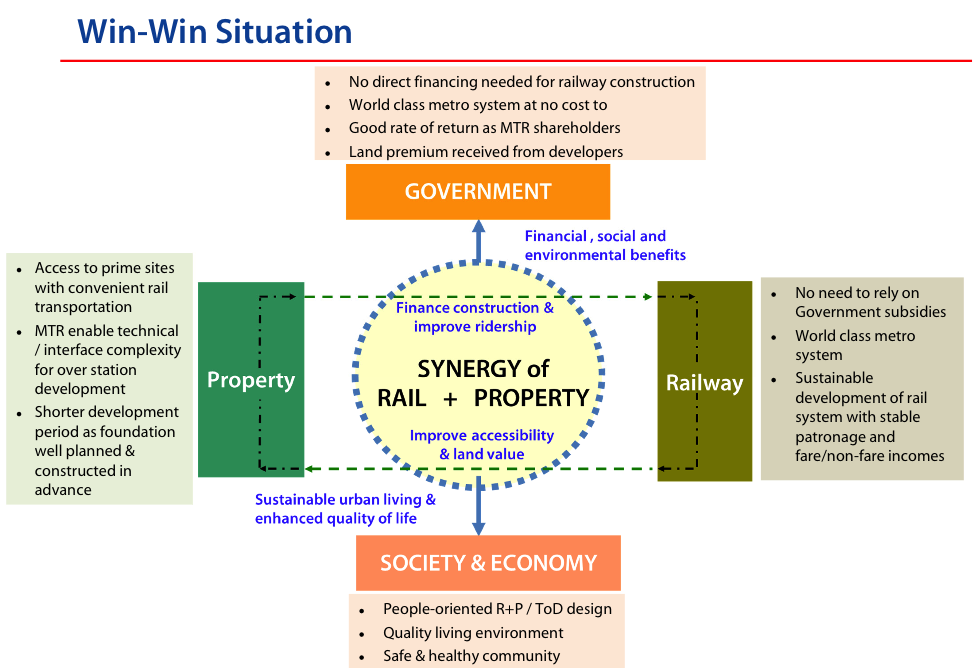
8.3 Unique Business Model
The R+P unique business model offers the following benefits:
Value:
- Enhances land value near stations, with property development profits supporting project financing.
Funding:
- Relies on private sector funding, alleviating the burden on the state budget.
Fare:
- Provides commuters with more affordable fare options.
Return:
- Offers investors the assurance of a stable and long-term financial return.
9.0 Key Success Factors & Risk Mitigation
9.1 Key Success Factors
- Team: A top international management team with a proven track record in successful project execution.
- Partnership: Collaborative engagement of PPP stakeholders and investors within a single entity.
- R + P Model: The rail and property funding and delivery model, providing a robust financial solution.
- Strategic Location (Hub): Choosing locations near city centers to ensure accessibility and convenience.
- High Density: Focusing on areas with a high density of commercial and residential properties.
Hong Kong MTR Planning Example: Dedicating 40% of land for open/green space.
Source: railknowledgebank. MTR Value Capture Model. Terry Wong 2016
9.2 Risk
- Financial: Investors must fund upfront costs during the railway operation period before realizing profits from property development. Real estate development cannot commence until the railway project is completed. This exposes investors to long-term risks related to property market fluctuations and project financing.
- Density: Ensuring sufficient population density may require government-driven migration programs to build the critical mass.
- Political: Investors require assurance of project continuity and financial returns despite potential political changes.
- ESG (Environmental, Social, Governance): Concerns about the project’s impact on the environment, social aspects, and governance require careful consideration.
9.3 Risk Mitigation
- Land Rights: Governments can grant development rights and reduce land costs to mitigate financial risk.
- Incentives: Governments can create initiatives and incentive programs to attract international investment and provide job prospects for new migrants.
- Team: Input from international stakeholders can help implement ESG policies and procedures and maintain strong corporate governance.
10.0 Exit Strategy
10.1 Forms of Exit
Exit options can include:
- IPO (Initial Public Offering): Taking the company public through the stock market.
- Buy-Out: Selling the business to a single entity or a group of investors.
- M & A (Mergers and Acquisitions): Selling the business to or merging with another company.
- Transfer: Handing over ownership and management to a new entity or individual.
10.2 Key Attractions for New Investors
- Portfolio: Mass transit rail projects offer stable, long-term returns, making them attractive as a portfolio investment.
- Revenue: Predictable and timely cash flows ensure financial stability.
- Demand: Mass transit rail provides an essential service with limited competitors, guaranteeing sustained demand.
- Inflation: Concession agreements often allow for adjustments to inflation rates, protecting against eroding real value.
- Barrier: High barriers to entry exist due to the high cost and complexity of project development, reducing competition.
- Cost: Consolidation of costs can be achieved through new acquisitions, optimizing operational efficiency.
- Finance: Financial providers are typically comfortable with leveraging due to stable long-term revenue streams, reducing investment risk.