“Along with Hiram’s fleet, the king had a fleet of large merchant ships that sailed the sea. Once every three years the fleet came into port with cargoes of gold, silver, ivory, apes, and peacocks.”
1 King 10:22 (NET)
“80% of global trade by volume is transported by sea. 60% of maritime trade passes through Asia. The South China Sea carries an estimated one-third of global shipping.”
CSIS (Center for Strategic and International Studies)
Discover the purpose of your work and your corporation
What is your purpose in work?
- You can help to serves as a guiding light, setting the gold standard for best practices within the burgeoning seaport industry of this developing nation.
- Your efforts aim to forge alternative maritime trade routes, alleviating the bottlenecks that pose significant challenges.
What drives your corporation’s core value?
- Enhance connectivity for economic growth and social benefits to the developing nations.
- Grow your company’s business in the emerging markets.
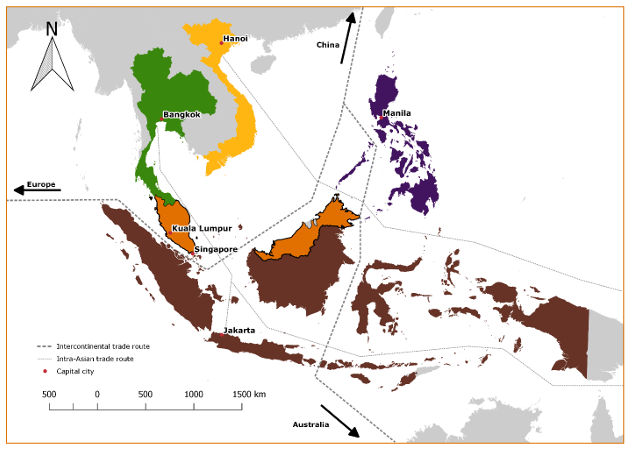
Borneo’s strategic location in Asia
1.0 Executive Summary
Mission
- Hub: The mission is to revolutionize Borneo into a prominent international maritime hub within the Asia-Pacific region.
- Entity: Form strategic alliances with public sectors, foreign investors, top-tier international seaport operators, and renowned shipping companies.
- Segment: Pioneer the establishment of six major seaports adjacent to the newly designated Special Economic Zones (SEZs).
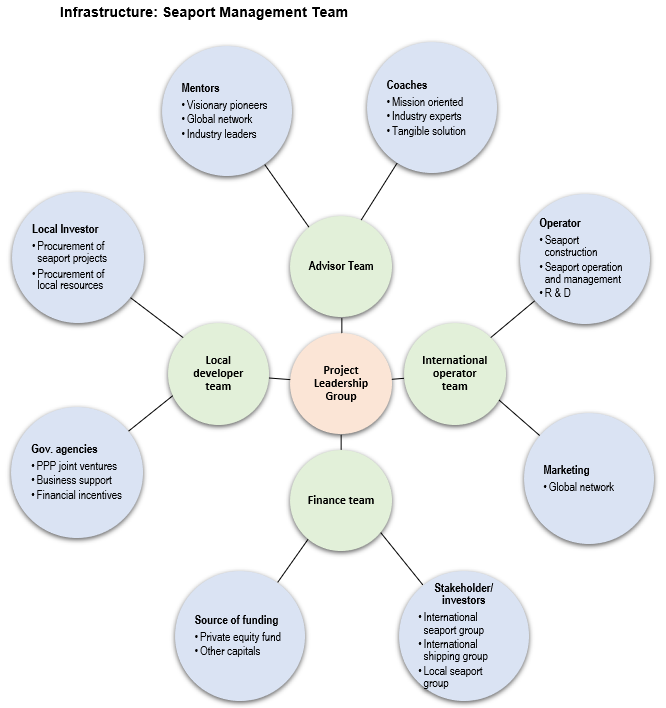
Key Management Team
- Mentors: Visionary leaders with a global network, offering invaluable guidance and inspiration.
- Coaches: Industry experts providing practical solutions, keeping the team focused on objectives.
- Partners:
- Project leaders with segment expertise and global seaport industry exposure.
- A respected investment manager with global funding sources in seaport operations.
- Target market group, such as shipping lines.
- Reliable local seaport operators with procurement capabilities, strong local networks, financial stability, and government backing.
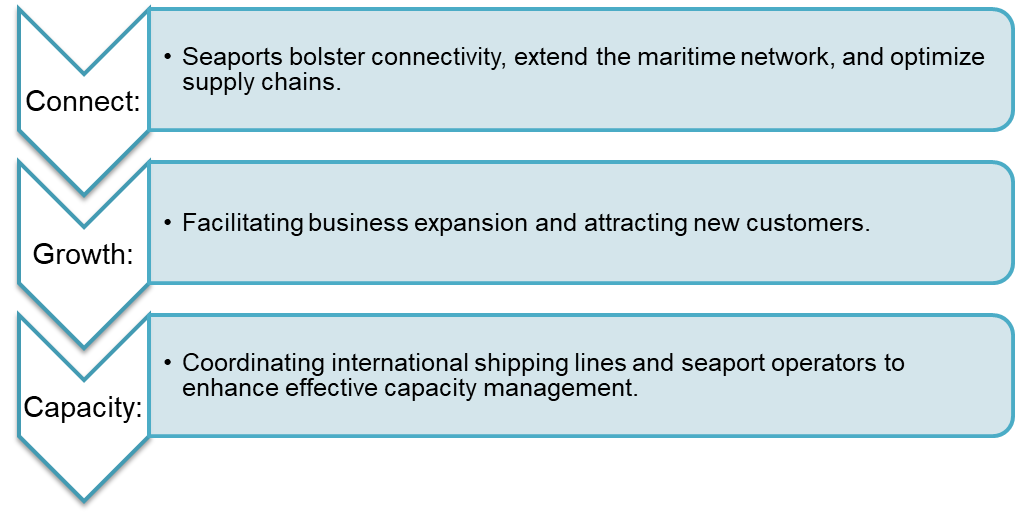
Product Benefits:
- Connect: Seaports bolster connectivity, extend the maritime network, and optimize supply chains.
- Growth: Facilitating business expansion and attracting new customers.
- Capacity: Coordinating international shipping lines and seaport operators to enhance effective capacity management.
Target Market:
Our focus is on the seaports within the SEZ hubs, including:
- Brunei: Oil and gas hub.
- Sandakan: Agriculture, aquaculture, and food hub.
- Lahad Datu: Transshipment and logistics hub in the Asia Pacific.
- Balikpapan: Mining and industrial hub.
- Banjarmasin: Manufacturing hub.
- Kijing: Palm oil downstream and manufacturing hub.
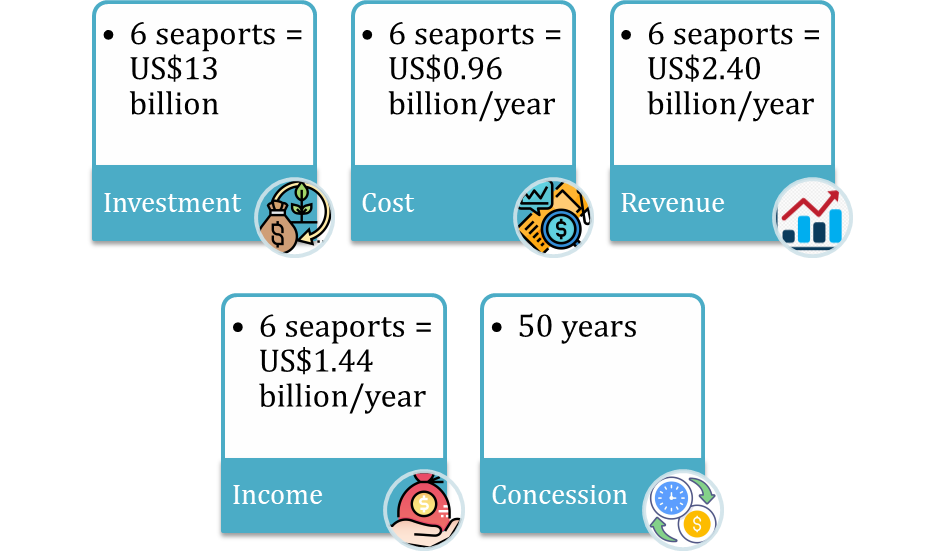
Financial Projections:
- Investment: 6 seaports = US$13 billion
- Cost: 6 seaports = US$0.96 billion/year
- Revenue: 6 seaports = US$2.40 billion/year
- Income: 6 seaports = US$1.44 billion/year
- Payback: 10 years (depending on scope and segment)
Unique Business Model:
- PPP: Embracing a Public-Private Partnership model.
- Team: Leveraging the proven track records of top global seaport groups.
- Attributes: Capitalizing on monopolistic and oligopolistic opportunities to gain a competitive edge.
- Value: Delivering added value by integrating SEZ and hinterland investments.
2.0 Mission
2.1 Problem
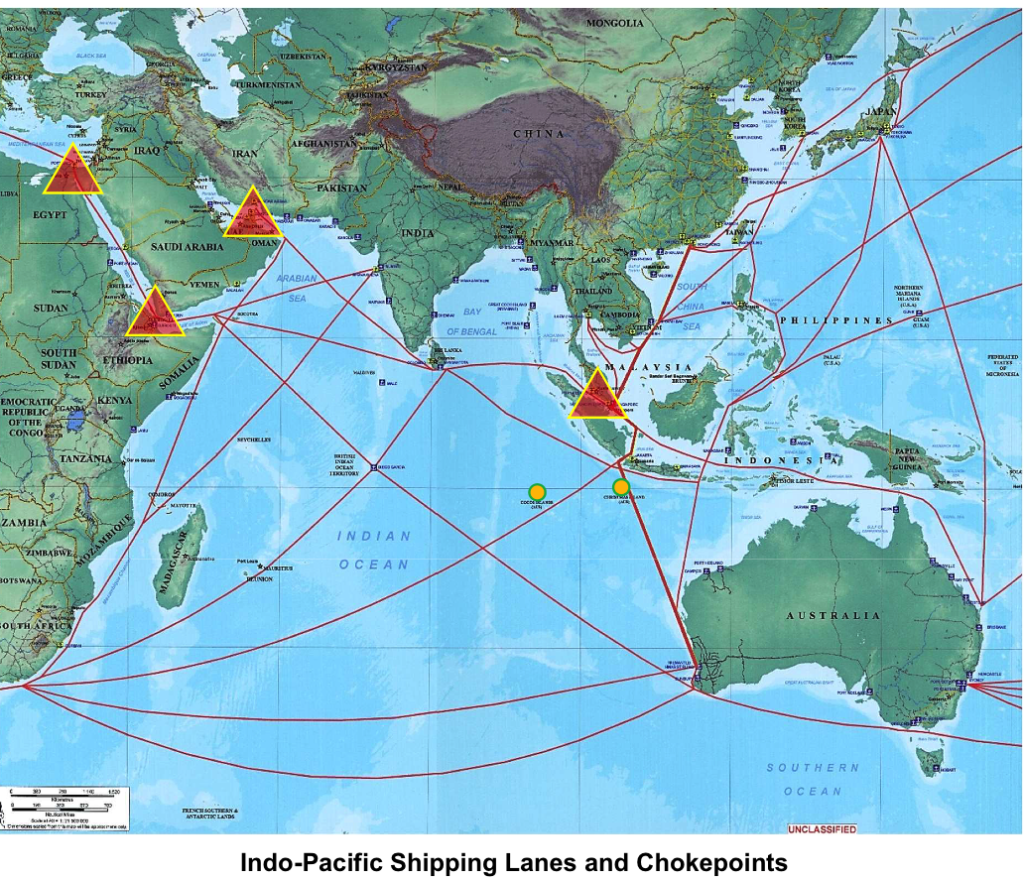
- Bottleneck: The Strait of Malacca’s constriction obstructs the vital sea lane, impacting major trade routes.
- Blockage: The 2021 Suez Canal blockage, caused by a stranded container ship, paralysed an estimated US$9.6 billion of trade per day. Importance of South China Sea maritime trade:
- 65% of China’s total trade.
- 42% of Japan’s total trade.
- 40% of global petroleum trade.
- 33% of global shipping.
- Geopolitics: Potential geopolitical conflicts can introduce volatility into the Malacca Strait, disrupting channel traffic.
- Closure: Prolonged closure of existing routes could cause catastrophic disruptions to the global supply chain.
- Consolidation: Borneo currently lacks a unified vision for harnessing its resources across three nations to transform the entire island into a singular, thriving maritime trade hub in the Asia Pacific.
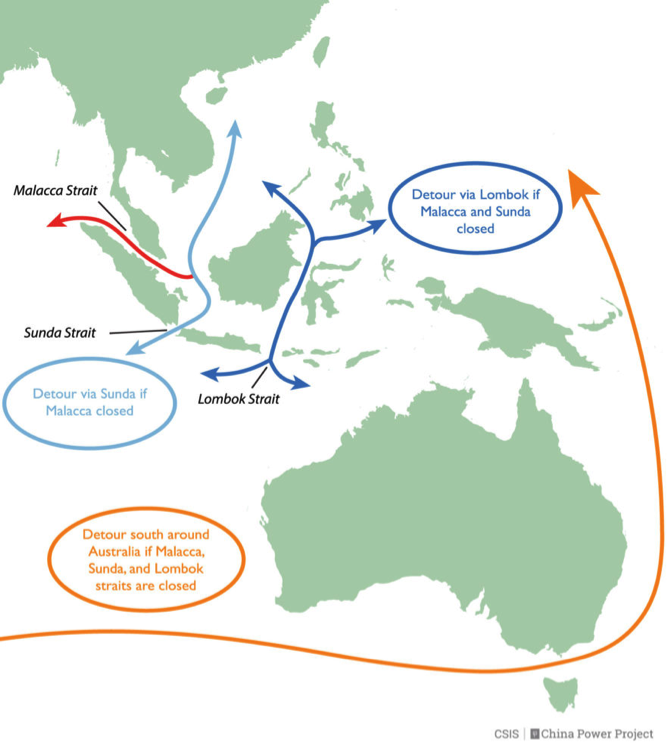
2.2 Solution
- Options: Borneo presents feasible alternative routes through the Java Seas, Celebes Sea, and South China Sea, connecting the Indian Ocean and the Pacific Ocean.
- Seaports: Borneo’s extensive coastline offers a wide array of potential seaport locations.
- SEZ: Establish specialized seaports adjacent to Special Economic Zones (SEZs) to create a dynamic industrial hub for the Asia Pacific region.
Alternate shipping routes
2.3 Mission
- Hub: To transform Borneo into a major international maritime hub in the Asia Pacific region.
- Entity:Form strategic alliance with public sectors, foreign investors, top international seaport operators and shipping companies.
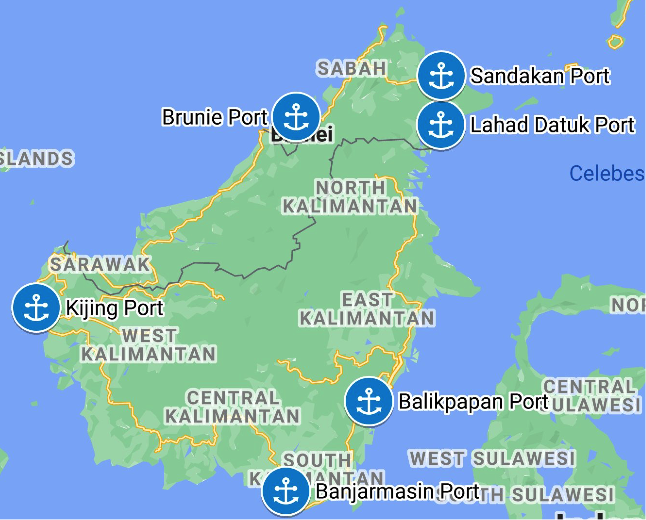
- Segment: Establish six major seaports next to the Special Economic Zones.
- Brunei: Oil and gas with downstream industries
- Sandakan: Agriculture and aquaculture
- Lahad Datuk: Maritime logistic hub of Asia Pacific
- Balikpapan: Mining and industrialBanjarmasin: Manufacturing
- Kijing: Agriculture downstream and manufacturing
Propose six new seaports with SEZs in Borneo
3.0 Product
3.1 Product Description
Hub: Borneo Island will become the key maritime and manufacturing hub in Asia Pacific.
Seaports: The six seaports link with new industrial hubs, manufacturing centres, and distribution sites for Asia Pacific markets. They offer alternate routes, easing South China Sea traffic.
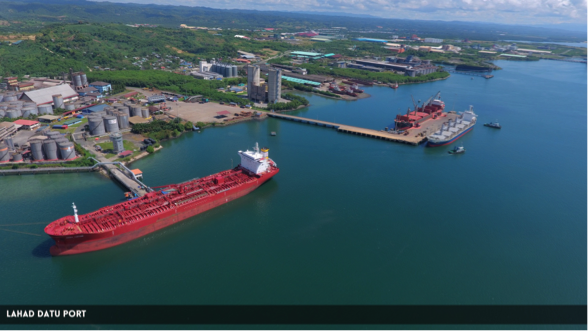
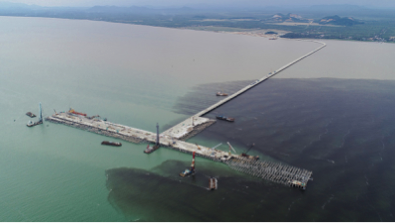
Transshipment: Lahad Datu Port transforms into Asia Pacific’s international logistics hub, with a 20-meter sea draft to accommodate large cargo vessels, enhancing global trade efficiency.
Lahad Datu port
3.2 Product Attributes
- Location: The seaports in Borneo will be strategically located to provide direct access to the trade routes for the global markets.
- Inland: The specialised seaports will form the hubs for the surrounding hinterland economic activities.
- Model: PPP model will develop the seaports, SEZ and the supporting facilities.
- Cargo: Breakbulk, dry bulk, liquid bulk, and containers.
3.3 Product Benefits
- Connect: Enhancing connectivity to expand the maritime network, thereby improving global, regional, and domestic supply chains.
- Growth: Facilitating business expansion and attracting new customers.
- ESG: An international consortium ensures Environmental, Social, and Governance (ESG) improvements and implements a transparent cost and profit-sharing structure.
- Capacity: Coordinating international shipping lines and seaport operators to enhance effective capacity management.
- Return: Offering long-term stability, reliable returns, and protection against inflation.
3.4 Product Competitive Advantages
- Location: Positioned at the heart of the Asia Pacific, Borneo’s new ports serve as a vital crossroads for major shipping routes connecting the Indian and Pacific Oceans.
- Resource: Borneo’s abundant natural resources and vast land make it an attractive destination for international investments, manufacturing, and business activities.
- Team: The top management teams boast successful track records in the seaport industry.
- IPN: An Integrated Port Network (IPN) ensures uniform standards, facilities, and tariffs, linking the six new ports and solidifying Borneo’s status as the premier maritime hub in the Asia Pacific.
4.0 Market
4.1 Market Segments
The market segments encompass specialized port areas including breakbulk, dry bulk, liquid bulk, and containers. Each port specializes in specific industries:
- Brunei: Focused on oil and gas and specialty chemicals.
- Sandakan: Specializing in agriculture and aquaculture.
- Lahad Datu: Positioned as the transshipment and logistics hub of the Asia Pacific for global maritime trade.
- Balikpapan: Primarily handling mining commodities.
- Banjarmasin: Functioning as a manufacturing hub.
- Kijing: Specializing in palm oil downstream and manufacturing activities.
Kijing Seaport, West Kalimantan. Land = 190.2 hectares, budget US$1 billion.
4.2 Target Market Strategy
The strategy hinges on three factors:
1. Need: Consolidate Borneo as Asia Pacific manufacturing hubs, with the seaports as major transshipment hubs.
2. Return: Assured stable, long-term returns will attract investors, thanks to SEZ incentives.
3. Feasibility: The top management team comprises successful international seaport specialists, ensuring a feasible execution.
4.3 Market Needs
- Route: The South China Sea carries one-third of global shipping.
- SEZ: Asian ports tend to integrate the global maritime logistical system with SEZ development.
- Security: Global market seeks alternate trade routes and demand for new ports for geopolitical needs.
- New tech: A thirst for more efficient connectivity at competitive pricing, digital technology and advanced port management.
- Cost: A growing need for a niche market in raw material and processing, agriculture, oil and gas, manufacturing, electronic, textile, telecommunication and specialty chemical industries in the lower-cost production centre.
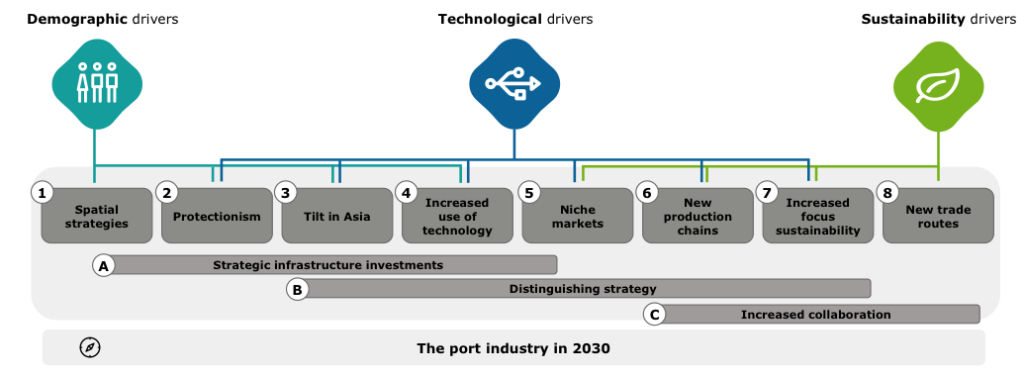
4.4 Growth Drivers
- Asia: The growth of middle-class Asians creates a growing demand for low-cost production centre. There is a shift to South East Asia manufacturing port hub.
- Digital: Technological drivers based on an increase of technology innovations for the new seaports value chain.
- Jobs: New foreign investment in the new seaports and SEZ hubs will spur economic activities and offer employment.
- Trends: Additional drivers are based on the future trends
4.5 Key Customers
Port Operators – Indonesia:
- SEO: PT Pelabuhan Indonesia (Pelindo) II.
- Gateway: Port of Tanjung Perak, a crucial transportation hub in East Java, serving as a gateway for goods distribution across the country.
- Busiest: Port of Tanjung Priok (PTP), the busiest in Indonesia, managed by PT Pelabuhan Indonesia Pelindo II. PTP houses the Jakarta International Container Terminal (JICT), majority-owned by Pelindo II (51%), with the remaining 49% held by Hutchison Port Holdings.
- Ports in Kalimantan:
- Banjarmasin, South Kalimantan
- Kijing, West Kalimantan
- Balikpapan, East Kalimantan
- Sampit, Central Kalimantan
- Samarinda, East Kalimantan
- Tarakan, North Kalimantan
Port Operators – Malaysia:
- Sabah: Sabah Ports Authority and Suria Capital, managed by Sabah Ports Sdn. Bhd.
- Sarawak: Sarawak State Ports Authorities and Bintulu Port Holdings. Major ports are in Kuching, Sibu, Bintulu, and Miri.
Port Operators – Brunei:
- Muara: Managed by Maritime And Port Authority Brunei Darussalam. Muara Port Company Sdn Bhd, a joint venture of Darussalam Assets Sdn Bhd and Beibu Gulf Holding (Hong Kong) Co., Ltd., handles the entire operation and management of Muara Port.
Major Stakeholders – Seaport:
- Ministry of Transport, Maritime and Port Authority of Brunei
- Kementerian Perhubungan (Ministry of Transportation) Indonesia, PT Pelabuhan Indonesia II (Persero)
- Ministry of Infrastructure and Port Development Sarawak
- Jabatan Keretapi Negeri Sabah (Ministry of Infrastructure Development Sabah)
4.6 Competition and Industry
1. Rank of Asean Logistics Performance
Country	   Asean Rank 		Global Rank
Singapore	    1			                 5
Malaysia	    2			                 32
Thailand	    3			                 45
Indonesia	    4			                 63
Vietnam	    5			                 64
Brunei		    6			                 70
Source: Infrastructure Investment in Indonesia. Colin Duffield, Felix Kin Peng Hui and Sally Wilson 2019 Open Book Publishers.
2. Competitors:
The Strait of Malacca currently stands as the world’s second-busiest waterway, covering a narrow distance of 550 miles. It serves as the shortest route connecting the Pacific and Indian Oceans, linking major Asian economies including India, Indonesia, Malaysia, Singapore, China, Japan, Taiwan, and South Korea. This vital route witnesses the passage of over 83,000 vessels annually.
Strait of Malacca
Global
Key players in seaport operation industry:
•	APM Terminals
•	China Harbour Engineering
•	China Merchants Port Holdings
•	COSCO Shipping Ports
•	Dubai Ports World
•	Evergreen Marine Corporation
•	Eurogate Terminal
•	Guangzhou Ports Holdings
•	Hutchison Port Holdings
•	ICTSI (International Container Terminal Services, Inc.)
•	MMC (Malaysia Marine and Heavy Engineering Holdings Berhad)
•	PSA International (Port of Singapore Authority)
•	SSA Marine (Stevedoring Services of America)
•	Terminal Investment Limited
Key players in shipping industries
American President Lines
Antong Holdings
Arkas Container Transport
CMA CGM Group
COSCO
Evergreen Marine
Global Feeder Shipping LLC
Grimaldi Group
Hamburg Süd Group
Hapag-Lloyd
Hyundai Merchant Marine
IRISL (Islamic Republic of Iran Shipping Lines)
Korea Marine Transport Corporation
Matson
Mediterranean Shipping Company (MSC)
Maersk (Moller–Maersk)
NileDutch
Ocean Network Express (ONE)
Orient Overseas Container Line (OOCL)
Pacific International Lines (PIL)
Regional Container Lines (RCL)
Salam Pacific Indonesia Lines
Sea Lead Shipping
Shandong International Transportation
Sinokor Merchant Marine
Sinotrans
SM Line
Swire Shipping
Transworld Group
TS Lines
UASC (United Arab Shipping Company)
Unifeeder
X-Press Feeders
Wan Hai Lines
Yang Ming
Zhonggu Logistics Corporation
ZIM (Zim Integrated Shipping Services)
The top ten shipping lines control 91.5% of the total fleet capacity.
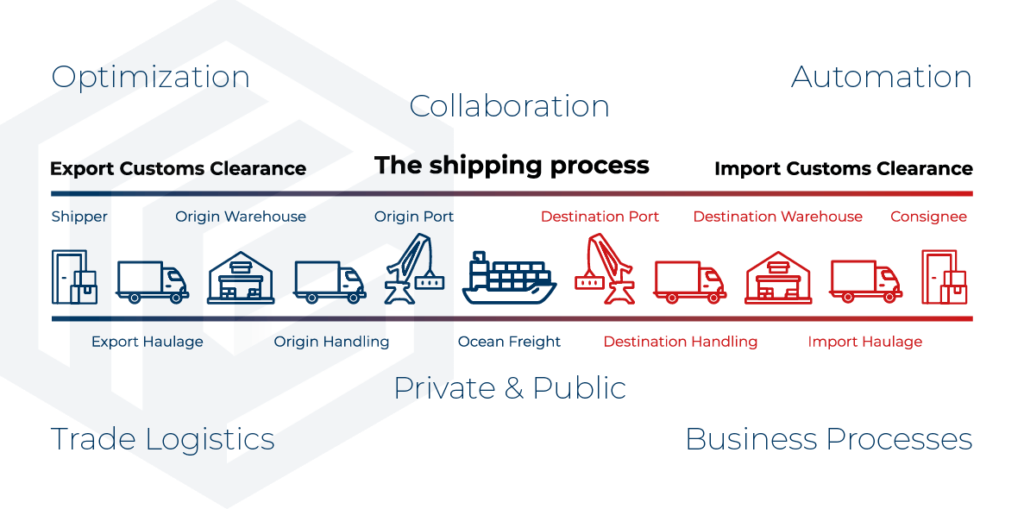
5.0 Operation
5.1 Port logistic flow chart
5.2 Port turnaround time – Number of days
Country          Dry Bulk Carriers       Container ships           LNG
China		       2.00			                     0.62			          1.21
Japan		       0.90			                     0.35			          0.99
Netherland     0.84			                     0.78		            	  1.30
Indonesia	       3.55			                     1.09			          1.38
Singapore	       0.12			                     0.77			          2.22
Malaysia	       3.42			                     0.76			          1.09
Source: UNCTAD 2019. Review of Maritime Transport 2019-Chapter 3
6.0 Financial Implications
6.1 Investment Segment
Phase 1: Development of six seaports with specialized adjacent Special Economic Zone (SEZ) industries.
Scope:
- Capacity for 30 million TEUs.
- Accommodating 600,000-tonne oil and gas super tankers.
- 50 container berths.
- Capacity for 16,000 TEUs container ships.
- 400 million tonnes of cargo throughput.
- 30 dry bulk berths.
- 18 kilometers of quay.
- 1,000 hectares of port land.
- Maximum vessel draft of 15 meters.
- 180 quay cranes.
- Handling 30 million tonnes of general cargo.
- Managing 50 million tonnes of dry bulk.
- Offering 150,000 warehouse facilities.
Investment:
- Brunei: US$1.2 billion.
- Sandakan: US$1.2 billion.
- Lahad Datu: US$7.0 billion.
- Balikpapan: US$1.2 billion.
- Banjarmasin: US$1.2 billion.
- Kijing: US$1.2 billion.
Total Investment: US$13.0 billion.
Case Studies
- Carey Island Port Project, Malaysia
- Land Area: 100 sq. km.
- Total Cost: US$50 billion (Port cost: US$37 billion)
- Scope: Port and industrial city
- Capacity: 30 million containers
- Description: The Carey Island Port Project in Malaysia is a massive development project that encompasses both a port and an industrial city. With a substantial investment of US$50 billion, it aims to become a significant hub for container handling in the region.
- Kuantan Port Expansion, Malaysia
- Land Area: 89.5 hectares (Phase 1A + 1B + 2)
- Project Cost: US$1 billion
- Concession: 30 years
- Capacity: 1.5 million TEUs
- Description: The Kuantan Port Expansion project in Malaysia involves the expansion of the existing port facilities. With a US$1 billion investment, it aims to increase its capacity to handle 1.5 million twenty-foot equivalent units (TEUs) over a 30-year concession period.
- Malacca Gateway, Malaysia
- Land Area: 246 hectares
- Total Cost: US$10.5 billion (Port cost: US$2 billion)
- Scope: Port and seafront development
- Description: The Malacca Gateway project in Malaysia is a substantial development that includes both a port and a seafront development. With a total investment of US$10.5 billion, it aims to enhance maritime connectivity and promote economic growth in the region.
- Patimban Deep Sea Port, Indonesia
- Land Area: 654 hectares
- Project Cost: US$3.29 billion (Phase 1 = US$1.5 billion)
- Capacity: 3.5 million TEUs
- Description: The Patimban Deep Sea Port project in Indonesia is a significant infrastructure development endeavour. With a project cost of US$3.29 billion, including a Phase 1 investment of US$1.5 billion, it aims to accommodate 3.5 million TEUs and contribute to the region’s economic growth.
- Gresik Port / DP World Maspion Group, East Java, Indonesia
- Land Area: 110 hectares
- Project Cost: US$1.2 billion
- Capacity: 3 million TEUs
- Description: The Gresik Port project in East Java, Indonesia, is a major undertaking in partnership with DP World Maspion Group. With a project cost of US$1.2 billion, it aims to have a capacity of 3 million TEUs and support regional trade and logistics.
6.2 Production cost
COGS:
Projected production cost for the six ports:
US$2.4 billion X 40% COGS = $0.96 billion/year
Case study
- COGS of listed companies
- Ratio: A study of the listed port operators of the cost of production (COGS) to revenue ranges 38% – 78%.
- Cost components
- Cost: There are four main port cost components: Terminal Handling Charges, Cargo Dues (Wharfage), Port Dues, and Marine Service Costs.
- Recent surge of charges
- COVID-19: Shipping and port charges have increased substantially since the COVID-19. In September 2021, the price for a 40-foot container from Shanghai to Rotterdam increased to $US14,287. That was a jump of 546% over 12 months. Terminal container fees have jumped 363% since 2017. Stevedores’ fees charged to load and unload cargo increased by 500%.
- Malaysia example 2019
Group                   TEU’s                   Revenue                    COGS         Cogs/Revenue
Bintulu Port      0.36 million	  US$174 million 	  US$95 million 	  55%
MMC 			 14.2 million 	  US$1.13 billion 	  US$678 million 	  60%
Suria Group      0.38 million 	  US$66 million 	  US$46 million 	  70%
Westports 	 10.5 million 	  US$429 million 	  US$161 million 	  38%
6.3 Prices and Revenues
Estimated: US$80/TEU

Projected revenue for the 6 ports:
US$80 X 30 million TEU’s = US$2.4 billion/year
Case Studies
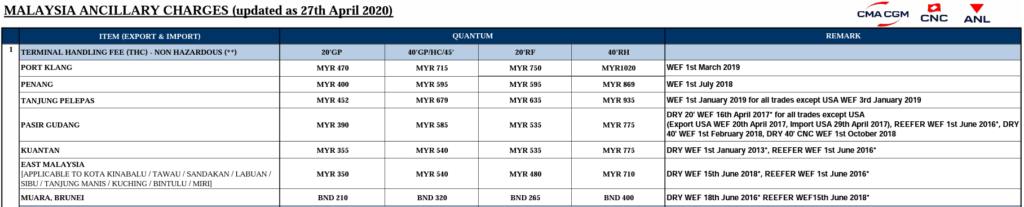
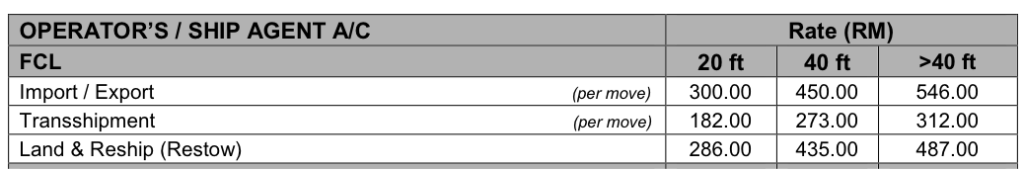
1. Malaysia Ancillary Charges 2020
2. Container Terminal Handling Tariff – Westport Malaysia 2021
6.4 Financial Return

Case studies – Indonesia
1. Port of Baubau Southeast Sulawesi / 2021
Project Cost: 	US$14.69 million
IRR: 			13.13%.
NPV: 			US$2.66 million
Concession: 	30 years
2. Bintung International Hub Port North Sulawesi
Project Cost: 	US$532 million
FIRR: 			13%
Concession: 	50-70 years
3. Kuala Tanjung International Hub Port North Sumatera
Project Cost: 	US$2.8 billion
FIRR: 			13.4%
NPV:			 US$406 million
4. Kabil Port (Tanjung Sauh Terminal) Batam
Project Cost: 	US$729 million
FIRR: 			15.91%
Concession: 	25 years
5. Patimban Port West Java / 2021
Project Cost: 	US$1.3 billion
IRR: 			13.4%
NPV: 			US$101.7 million
Concession: 	40 years
6. Anggrek Port / 2021
Project Cost: 	US$97.4 million
IRR: 			11.8%
NPV: 			US$4.7 million
Concession: 	30 years
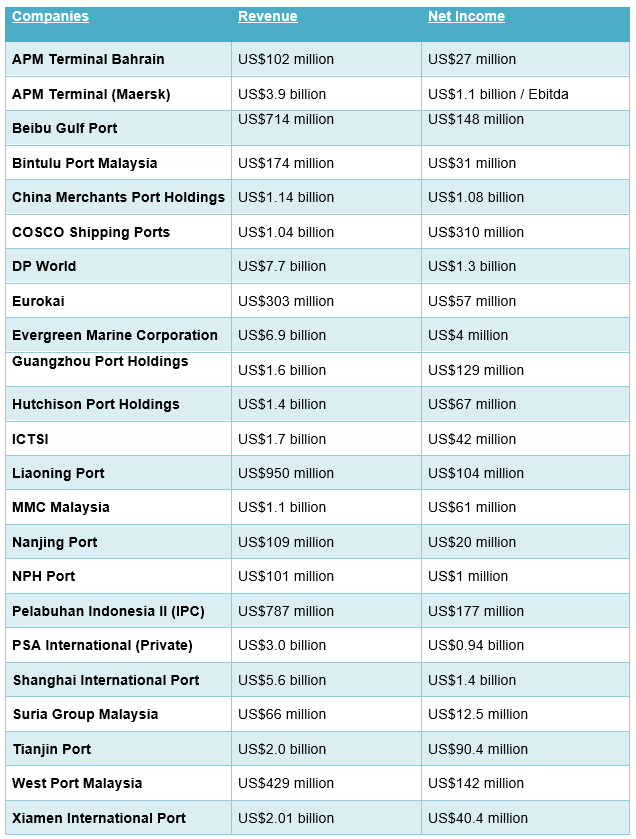
2019 Financial Income of listed seaports companies.
6.5 Source of Funding
1. Strategic Investors:
- New Investor: A project leader with a focus on business and financial management.
- Financier: Seaport private equity firms and investor groups.
- Seaport Group: International and local seaport groups.
- Target Market: Key international shipping companies.
2. Private Equity Fund and Investors:
- Acadian Asset Management
- Achillion Holdings
- Advent Capital Management
- Alinda Capital Partners
- American Century Investment Management
- AMP Capital
- Antin Infrastructure Partners
- APM Terminals
- Arcus Infrastructure Partners
- AXA IM Alts (AXA Investment Managers)
- BlackRock Advisors
- Blackstone Infrastructure Partners
- Bravo International Port Holdings
- Brookfield Asset Management
- Capital International
- Capital Research & Management
- Carrix
- CCB Principal Asset Management
- China Investment Corp
- China Merchants Fund Management
- China Southern Asset Management
- China Universal Asset Management
- CMA-CGM
- COSCO Shipping Ports
- CTBC Investments
- Da Cheng Fund Management
- Danske Bank Investment Management
- DIF Capital Partners
- Dimensional Fund Advisors
- DJE Kapital
- DP World
- Dr. Boss Finanz Management
- DWS Investments
- EARNEST Partners
- Eastspring Investments
- ESFC Investment Group
- Evergreen International
- Ferrovial
- Fidelity Management & Research
- Fiera Capital
- Finlabo Sim
- Fourton Fund Management
- Geode Capital Management
- GF Fund Management
- Gfund Management
- GIG Asset Management
- Global Infrastructure Partners
- Goldman Sachs Asset Management International
- Goldstate Capital Fund Management
- Guangxi Transportation Development Investment Fund
- Gutmann Finanz Strategien
- Handelsbanken Fonde
- Harvest Fund Management
- HC Capital Advisors
- Hermes Investment Management
- HIG Capital
- HSBC Global Asset Management
- Hutchison Port Holdings
- ICBC Credit Suisse Asset Management
- IFM Investors
- Infracapital
- Infravia Capital Partners
- Indonesia Infrastructure Finance
- ING Infrastructure Finance
- International Container Terminal Services
- Invesco Asset Management
- J.P. Morgan Asset Management
- Kleinheinz Capital Partners
- Kontor Stöwer Asset Management
- Macquarie Infrastructure and Real Assets
- Maersk Group
- Manulife Investment Management
- March Asset Management
- MEAG
- Meridiam Infrastructure
- Mellon Investments
- Mesirow Financial Investment Management
- MetLife Investment Management
- MFI Asset Management
- Modern Terminals
- MSC (Mediterranean Shipping Company)
- Ningbo-Zhoushan Port Group
- Noatum
- Norges Bank Investment Management
- Northleaf Capital Partners
- Orient Overseas International Ltd. (OOIL)
- Pantheon Ventures
- Plenary Group
- Proaktiva
- PSA International
- Robeco Institutional Asset Management
- RREEF America
- Schafer Cullen Capital Management
- Sealand Securities Investment Management
- Shanghai International Port Group
- Silchester International Investors
- South Port Investment Holdings
- SSgA Funds Management (State Street Global Advisors)
- Temasek Holdings
- Templeton Global Advisors
- Third Avenue Management
- Thornburg Investment Management
- Value-Holdings Capital Partners
- Van Eck Associates
- Vanguard Group
- Wharf Holdings
- William Blair Investment Management
- Yielco Investments
- Yildirim Group
- Yinhua Fund Management
- Zhong Ou Asset Management
- Zhongrong International Trust
3. Consultants, Development and Fund Managers to the Seaport Industry:
- Asian Development Bank
- Asian Infrastructure Investment Bank
- BCG (Boston Consulting Group)
- BMT (British Maritime Technology)
- Clarksons Research
- Deloitte
- Drewry Maritime Advisors
- Ernst & Young (EY)
- IJInvestor
- Indonesia Infrastructure Guarantee Fund (IIGF)
- Indonesia Investment Authority (INA)
- Indonesia Investments
- IMF (International Monetary Fund)
- Infrastructure Asia
- International Maritime Organization (IMO)
- KPMG
- Louis Berger
- McKinsey & Company
- Preqin
- PwC (PricewaterhouseCoopers)
- Sarana Multi Infrastructure (SMI)
- Shipping Alliances (2M, Ocean Alliance, The Alliance)
- UNCTAD (United Nations Conference on Trade and Development)
- Wilhelmsen
- World Bank
6.6 Revenue Opportunities
The potential upside revenues for the project include:
- SEZ Profit: Realizing increased profits from the Special Economic Zone (SEZ) property development, which can result from a lucrative land deal.
- Integration Benefits: Capitalizing on both vertical and horizontal integration activities within the project’s scope to generate additional revenue streams.
7.0 Management Team
7.1 Key Management Team
1. Mentors: Visionary leaders with a global network, offering invaluable guidance and inspiration.
2. Coaches: Industry experts providing practical solutions, keeping the team focused on objectives.
3. Partners:
- Project leaders with segment expertise and global seaport industry exposure.
- A respected investment manager with global funding sources in seaport operations.
- Target market group, such as shipping lines.
- Reliable local seaport operators with procurement capabilities, strong local networks, financial stability, and government backing.
In the seaport industry, several global leaders have made significant contributions, shaping its growth and success. Here is a list of some of these remarkable individuals, honoured for their vision and dedication:
- Eric Ip
- Christian Gonzalez
- Ammar Kanaan
- Rodolphe Saadé
- Knud Stubkjær
- Keith Svendsen
- Peter Voser
- Wang Xiufeng
- Zhu Tao
These are just a few of the outstanding professionals and captains of the industry. The readers are encouraged to explore further and conduct their research to learn more about the management teams in this dynamic field.
7.2 Key Management Team Model
8.0 Unique Business Model
8.1 Successful Track Record
In building the unique business model, success relies on selecting proven industry leaders. For the new ports, partnering with international port operators boasting an outstanding track record is crucial for success. Ports like London, Singapore, and Rotterdam are home to top-performing operators known for their quality infrastructure, research, training, service excellence, and financial returns. Strategic alliances with these established players can enhance market share, competitiveness, and industry networking.
8.2 Entry Model The entry model involves establishing a Public-Private Partnership (PPP) by forming a joint venture entity that includes international consortiums, local seaport operators, and government agencies.
8.3 Unique Business Model (Continued)
- Team: Leveraging the successful track records of global seaport groups.
- Attributes: Capitalizing on monopolistic and oligopolistic opportunities to gain competitive advantages.
- PPP: Strategically aligning goals with partners who bring expertise in terminal operation, shipping, finance, and port management.
- Value: Enhancing value through the integration of Special Economic Zones (SEZs) and hinterland investments.
9.0 Key Success Factors & Risk Mitigation
9.1 Key Success Factors
- Team: Assemble a top-tier international management team with a proven track record.
- Partnership: Establish a strong Public-Private Partnership (PPP) with stakeholders and investors sharing common goals.
- Finance: Ensure a robust financial solution to support the project’s execution.
- Demand: Secure strategic partnerships with shipping lines to guarantee a customer base.
- Location: Leverage the advantageous proximity of the seaports to international shipping lanes and easy access to the economic hinterland.
9.2 Risks
- Will: The challenge of fostering the willingness to change and eliminate bureaucracy.
- Political: Concerns about political instability and potential changes in regulatory policies that might affect foreign investors.
- Financial: The issue of bankability, with investors seeking assurance regarding the feasibility and financial viability of port projects.
- ESG (Environmental, Social, Governance): Investors’ concerns about the project’s impact on the environment, society, and governance, as well as its relationship with the local community.
9.3 Risk Mitigation
- Phased Launch: Implement a phased approach to launching the seaport based on demand.
- Diverse Partnerships: Foster partnerships with financiers, terminal operators, and shipping lines to diversify risk.
- COVID-19 Response: Be prepared for fluctuations in demand due to factors like COVID-19, employing strategies such as blank sailing and vessel layup to manage capacity. Rates can surge when demand rebounds post-lockdown.
- Product Focus: Initially, focus on handling basic commodities and transshipment to minimize risk.
- Technology: Embrace digitalization to enhance overall performance.
- Portfolio Diversification: Diversify the port portfolio and services to reduce the impact of economic downturns and cyclicality.
10.0 Exit Strategy
10.1 Forms of Exit
- Initial Public Offering (IPO)
- Buy-out
- Merger and acquisition (M&A)
- Transfer
10.2 Key Attractions for New Investors
- Portfolio Stability: The sea project offers a stable return on investment over the long term.
- Essential Service: Seaports provide an essential service with limited competition, ensuring consistent demand.
- High Entry Barriers: High barriers to entry due to the significant cost and complexity of the business, making it less susceptible to new entrants.
- Cost Consolidation: Opportunities for cost consolidation through new acquisitions.
- Growth Potential: The potential to capitalize on growth opportunities in emerging markets and alternative maritime trade routes.