“My people will abide in a peaceful habitation, in secure dwellings, and quiet resting places.”
Isaiah 32:18 (RSV)
“Land monopoly is not only monopoly, but it is by far the greatest of monopolies; it is a perpetual monopoly, and it is the mother of all other forms of monopoly.”
Winston Churchill, former UK Prime Minister (1874-1965)
Discover the purpose of your work and your corporation
What is your purpose in work?
• Pioneering a novel vision for the future trajectory of residential living.
• Initiating an ambitious blueprint for holistic service centres, aiming to revolutionize the traditional shopping mall setup.
What drives your corporation’s core value?
• Revolutionising the retail landscape, establishing a fresh paradigm to meet diverse needs comprehensively.
• Recognising and seizing opportunities to invest in emerging markets.
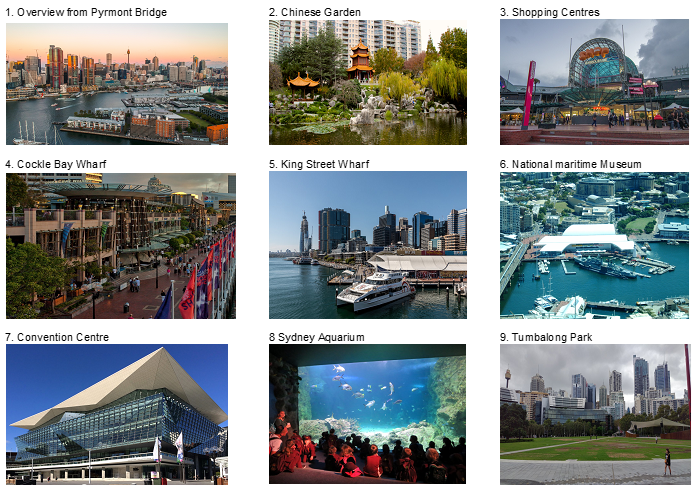
Darling Harbour Sydney Australia
1.0 Executive Summary
Mission
- Entity: Forming a property consortium in collaboration with international property groups, financial investors, government agencies, and local property developers.
- Stage 1: Developing 9 million dwellings and 248 commercial projects in the specified target segments.
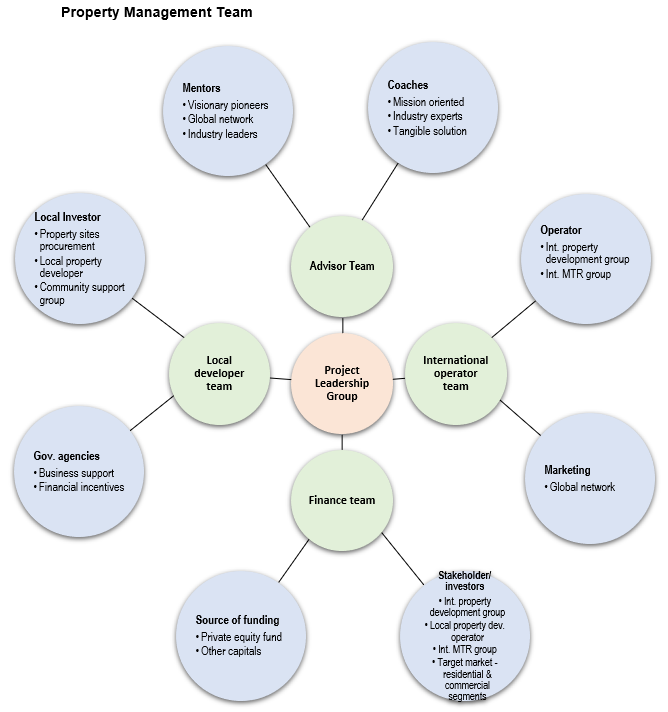
Key Management Team
- Mentors: Visionary pioneers and industry leaders with an extensive global network providing invaluable guidance and inspiration.
- Coaches: Mission-oriented industry experts offering practical solutions to challenges, ensuring the team stays focused on its objectives.
- Partners:
- A project leadership group with a successful track record in the development, operation, and financial management of the property industry.
- Reputable investment manager with access to funding sources in the property industry.
- International property groups.
- A reputable local property group with procurement capabilities, a local network, sound financial status, and solid government support.
Product Benefits
- Team: Partnering with target market customers, MTR transportation groups, property developers, financial investors, and government agencies with successful track records.
- Model: The Rail + Property development model funding new mass transit rails and creating integrated commercial and residential communities.
- Unique: Urban design theme with large open landscaped space.
Target Market
- Target: Residential – 3 million public servants and 3 million new migrants to the New Indonesian Capital and other major cities. Commercial – 23.5 million residents and 30 million tourists.
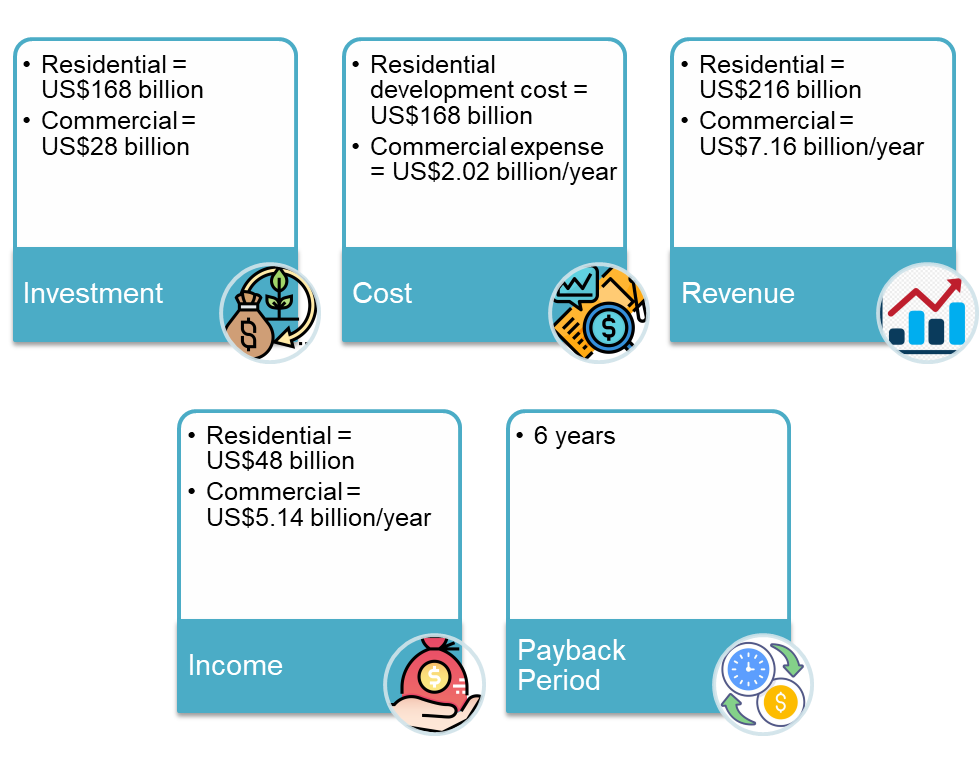
Financial Projections
- Investment:
- Residential = US$168 billion
- Commercial = US$28 billion
- Cost:
- Residential development cost = US$168 billion
- Commercial expense = US$2.02 billion/year
- Revenue:
- Residential = US$216 billion
- Commercial = US$7.16 billion/year
- Income:
- Residential = US$48 billion
- Commercial = US$5.14 billion/year
- Payback: 6 years
Unique Business Model:
- Team: Joint partnership with established property groups.
- Target: Strategic alliance with target market segments to secure customers.
- Integrate: Integration with other social, community, entertainment, and other attractions will offer comprehensive services and products.
2.0 Mission
2.1 Problem
- Health: The threat and vulnerability of residing in densely populated Asian cities were starkly exposed by COVID-19. Cities like Shanghai (27M), Beijing (20M), Delhi (30M), Tokyo (37M), Seoul (10M), Mumbai (20M), and Jakarta (11M) faced significant challenges.
- Capital: The establishment of Indonesia’s new capital in Kalimantan is expected to stimulate fresh economic activities and spur migration, resulting in an increased demand for property.
2.2 Solution
Planning: Strategically planned property development to accommodate the anticipated population growth of 18 million across eight major cities.
| Country | City | 2020 Pop. | 2050 Population (M) |
| Indonesia | Samarinda | 843K | 3.3M |
| Banjarmasin | 732K | 2.9M | |
| Balikpapan | 682K | 2.7M | |
| Pontianak | 668K | 2.7M | |
| New Capital | 1.5M (3 years) | 6.0M | |
| Malaysia | Kuching | 612K | 2.5M |
| Kota Kinabalu | 550K | 2.2M | |
| Brunei | Bandar Sri Begawan | 300K | 1.2M |
| Total | 5.917M | 23.5M |
2.3 Mission
- Entity: Establish a property consortium in collaboration with international property groups, financial investors, government agencies, and local property developers.
- Scope: Develop 9 million dwellings and 248 commercial projects within the target segment.
3.0 Product
3.1 Product Description
- Residential:
- Per year: 600,000 dwellings for the combined population of the eight cities.
- Total: 9 million dwellings over a span of 30 years.
- Commercial:
- 8 CAD District Centres:
- Catchment Population: 8 million residents + 30 million tourists.
- 40 Regional Centres:
- Catchment Population: 4 million residents.
- 200 Suburban Centres:
- Catchment Population: 6 million residents.
- 8 CAD District Centres:
Retail and population catchment centres–Australia example
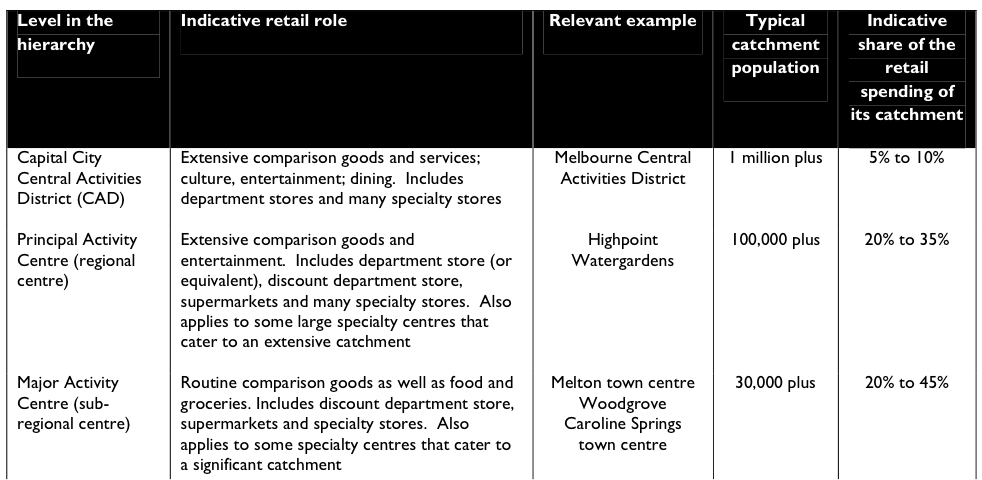
(Note: Changes to current activity centre hierarchy in Victoria (2014 to present): Central City / National Employment and Innovation Cluster /Metropolitan Activity Centre.
In the old hierarchy Highpoint and Watergardens were identified as Principal Activity Centres. Under the current activity centre hierarchy Principal Activity Centres have been removed. Now Highpoint and Watergardens are identified as Major Activity Centres and are on the same level as Woodgrove, Melton (High Street) and Caroline Springs.
The catchments in the image were superseded in the City of Melton Retail and Activity Centres Strategy, March 2014 , which identified that Major Activity Centres have a catchment of around 50,000 people (35-70,000), whereas the background report had indicated that the catchment was 30,000 for a Major Activity Centre.)
3.2 Product Attributes
- Residential:
- Target: 60% of 9 million dwellings for affordable housing = 5.4 million dwellings.
- New Township: 8 towns with a total of 675,000 affordable dwellings each.
- Commercial:
- CAD Centres: 1,000,000 m² X 8 centres = 8 million m².
- Regional Centres: 200,000 m² X 40 centres = 8 million m².
- Suburban Centres: 60,000 m² X 200 centres = 12 million m².
- Positioning:
- Diverse themes including culture, tourism, sports, food, electronics, fashion, hypermarkets, medical, tropical gardens, fun parks, entertainment, outdoors, discount, department stores, jewellery, hotels, specialty shops, health services, hobbies, cultural activities, community services, furniture, landscape, home building, education, real estate, exhibitions, town squares, aquariums, transport facilities, and supporting services.
- Transport:
- Proximity to public transportation systems.

Naghshejahan Square Isafahan–Iran. Source: Wikipedia. Dolphinphoto5d, 2018 
SM Mall Philippine 590K m2 / 73 million visitors. Source: Wikipedia. Jimaggro, 2014 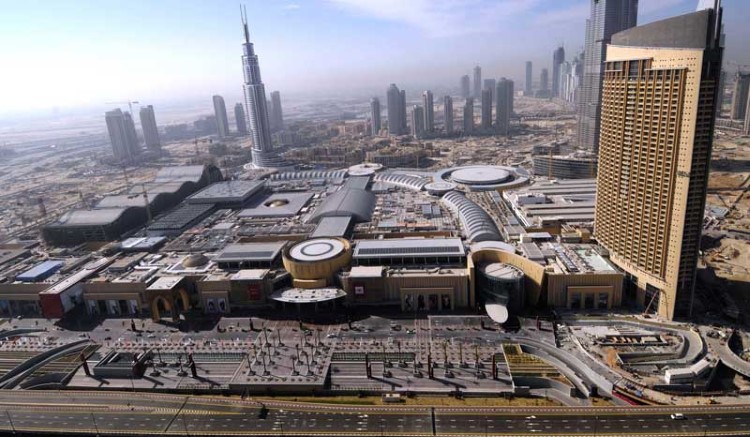
Dubai Mall 500K m2 / 84 million visitors. Source: Interesting Eng. 2014 
Sydney Darling Harbour/visitors 4.8 million. Source: Wikipedia. Maksym Kozlenko, 2019
3.3 Product Benefits
- Team:
- Partnerships with target market customers, MTR transportation groups, property developers, financial investors, and government agencies with successful track records.
- Model:
- The Rail + Property development model will fund new mass transit rails and create integrated commercial and residential communities.
- Unique:
- Urban design theme with large open landscaped spaces.
3.4 Product Competitive Advantages
- Demand:
- Secured demand from the relocation of the new capital.
- Success:
- Involvement of international and local property groups to enhance the success of the projects.
- Viability:
- Financial support from international and local investors with solid backing from the government.
- Frontier:
- Borneo provides a vast land bank and a beautiful environment, offering a unique frontier for development.
4.0 Market
4.1 Market Segment
Residential:
- High-end residential development = 10%
- Medium-density housing = 30%
- Affordable Housing = 60%
- Focus on 5.4 million affordable dwellings.
Commercial:
- City Mall = 8 centres
- Regional Mall = 40 centres
- Suburb Mall = 200 centres
4.2 Target Market Strategy
Residential:
- Location: Suburb
- Transport: MTR route.
- Pricing: US$35K – US$40K/affordable dwelling
- Theme: Large open outdoor landscaped space, social, community, cultural, sport, education, religious, medical, and health care facilities.
- GDP 2050:
- US$20K/capita/year (Indonesia)
- US$28K/capita/year (Malaysia)
- US$66K/capita/year (Brunei)
Commercial:
- City Centre: Tourist and office workers
- Regional Centre: Central locations within the suburbs with a hypermarket, specialist shops, facilities, and community services.
- Suburban Centres: Local shopping centres
4.3 Market Needs
Affordable Housing:
- New Capital: Public servants (Stage 1 = 1.5 million / total = 3 million).
- Migrant Workers: 3 million.
Commercial Malls:
- 2050 target visitors
- Residents: 25 million
- Tourists: 30 million
4.4 Growth Drivers
- Population:
- Rural, domestic, and regional migration to the new capital and regional cities for job opportunities.
- Tourism:
- Tourism growth will spur new hotel and city mall developments.
- Investment:
- New economic activities will accelerate the business, industrial, and manufacturing industries.
4.5 Key Customers:
- Target: Residential
- 3 million public servants of the New Indonesian Capital
- 3 million new migrants to the regional cities.
- Commercial
- 25 million residents
- 30 million tourists
4.6 Industry and Competition
Top international property group
- American Tower Corporation
- Brookfield Asset Management
- Equinix
- Hammerson
- Klepierre
- Link REIT
- Lendlease
- Prologis
- Segro
- Simon Property Group
- SM Investments
- Unibail-Rodamco
- Vonovia
Top property group in Asia
- CapitaLand
- CK Asset Holdings
- Frasers Property
- Hongkong Land Holdings
- Henderson Land Development
- Mitsubishi Estate
- New World Development
- Wheelock
Key local property developers
- Agung Podomoro Land
- BN Hartajati
- Ciputra Development
- Komtar
- Lippo Group
- RDTX Group
- Sinar Mas Land
- Sunway Group
- YTL Corporation
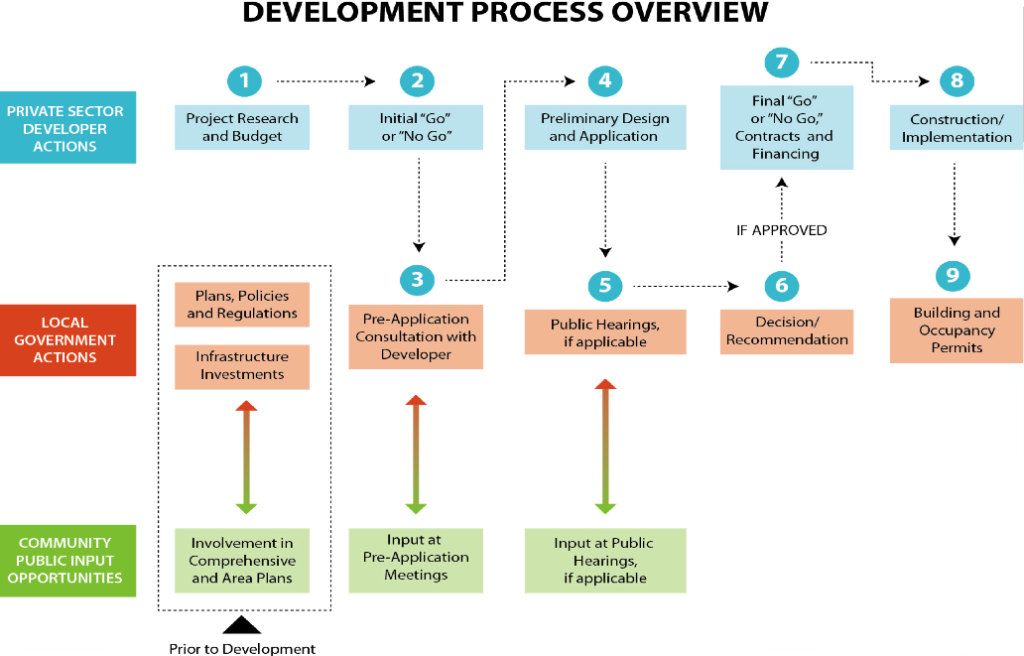
5.0 Operation
5.1 Operation–development process
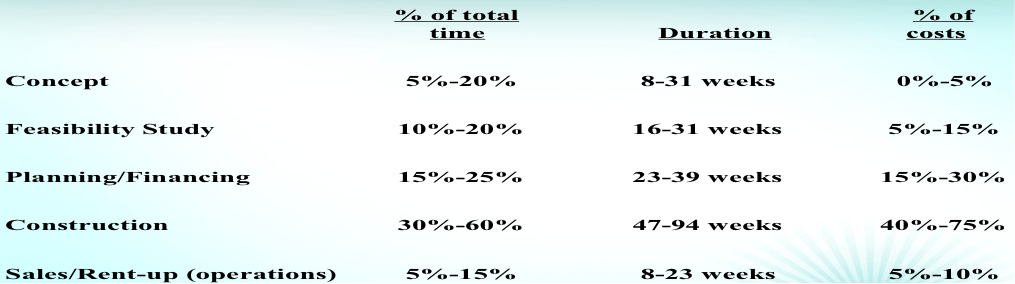
5.2 Operation–Timeline
6.0 Financial Implications
6.1 Investment Segment
Residential:
- 5.6 million dwellings X US$30K = US$168 billion
Commercial Mall Centre:
- 28 million m² X US$1,000/m² = US$28 billion
6.2 Property Production Cost
Residential Development Cost:
- 100 m² X US$300/m² = US$30,000/dwelling
- Total = US$168 billion
Commercial Expenses:
- US$72/m²/year X 28 million m² = US$2.02 billion/year
Case Study 1: 2019 Indonesia Construction (US$/m²)
- Apartments, high rise, average standard:
- Low: $750
- High: $850
- Terraced houses, average standard:
- Low: $383
- High: $498
Case Study 2: 2020 Malaysia (Kota Kinabalu) Construction (US$/m²)
- Average standard apartments, high rise:
- Low: $330
- High: $470
- Low-cost flats, high rise (<15 levels):
- Low: $190
- High: $210
Case Study 3: 2020 Malaysia (Kuching) Construction (US$/m²)
- Average standard apartments, high rise:
- Low: $360
- High: $410
- Low-cost flats, high rise (<15 levels):
- Low: $240
- High: $270
Case Study 4: 2019 Malaysia (Kuala Lumpur) Construction
- Terraced houses, average standard:
- Low: $220
- High: $345
Case Study 5: Retail Construction Cost 2019
Indonesia:
- Retail malls high-end:
- Low: US$675/m²
- High: US$730/m²
- Out-of-town shopping centre, average standard:
- Low: US$611/m²
- High: US$675/m²
Malaysia:
- Retail malls high-end:
- Low: US$680/m²
- High: US$1,000/m²
- Out-of-town shopping centre, average standard:
- Low: US$550/m²
- High: US$715/m²
6.3 Prices and Revenues
Residential:
- 5.4 million dwellings X US$40K/dwelling = US$216 billion
Commercial Retail Revenues:
- Rental:
- US$193.20/m²/year X 28 million m² = US$5.41 billion/year
- Services:
- US$62.4/m²/year X 28 million m² = US$1.75 billion/year
- Total:
- US$7.16 billion/year
Case Study 1: Residential Housing (Low to High-end)
- Balikpapan: US$20K – US$90K
- Kota Kinabalu: US$60K – US$500K
- Kuching: US$60K – US$300K
- Brunei: US$100K – US$400K
Case Study 2: Malaysia Retail Revenue and Expenses 2020
- Occupancy Rate: 88%
- Rental: US$16.10/m²/month
- Services/Promotion: US$5.20/m²/month
- Expenses: US$6.00/m²/month
Case Study 3: Malaysia Mall Income 2018
- Successful malls (One million sq. ft.): RM100 million net income annually.
Case Study 4: Retail Spending Per Capita–Australia

6.4 Financial Returns
Revenue – Cost = Income
Residential:

•	Revenue: US$216 billion
•	Cost: US$168 billion
•	Income: US$48 billion
Commercial Retail:

•	Revenue: US$7.16 billion/year
•	Cost: US$2.02 billion/year
•	Income: US$5.14 billion/year
•	Payback: 6 years
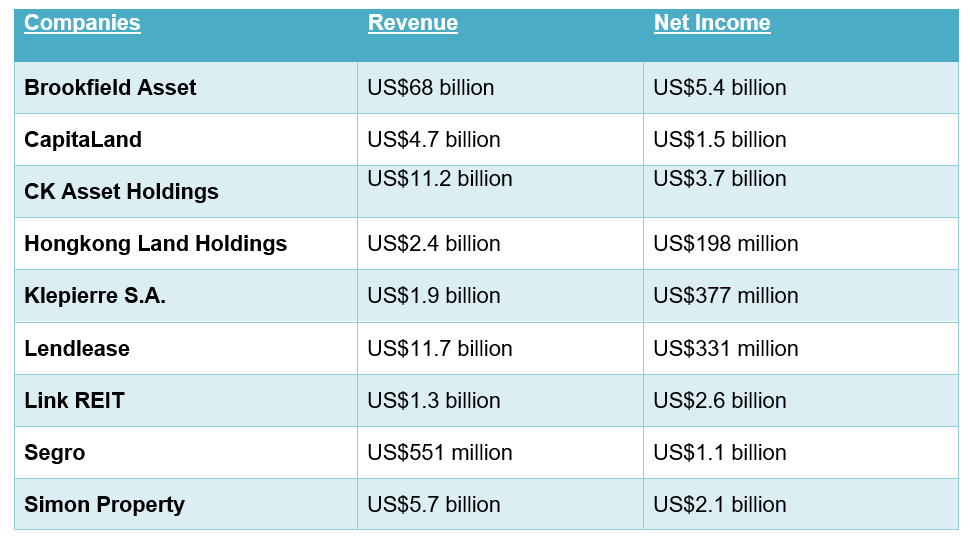
2019 International Property Group
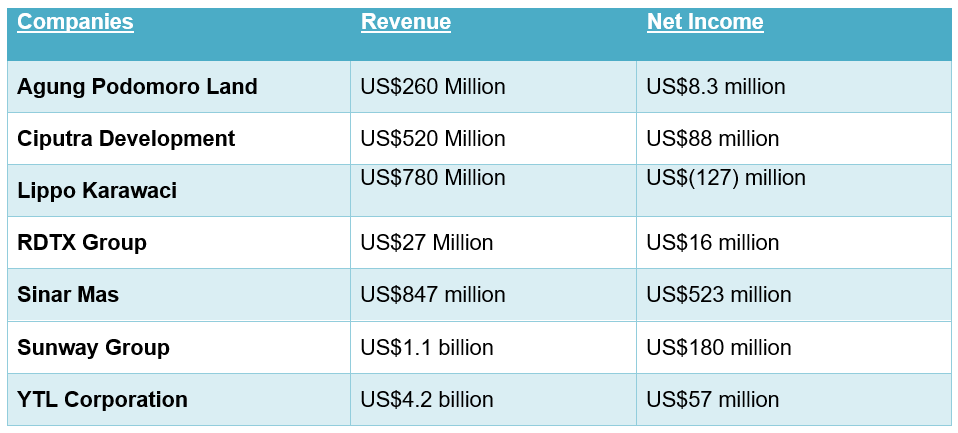
2019 Local Property Group
6.5 Source of Funding:
1. Strategic Investors
- New Investor:
- Project leadership team with business and financial management focus.
- Financier:
- Property private equity groups.
- Developer:
- International and local property developer groups.
- Target Market:
- Government servants and migrant workers.
2. Private Equities and Investors
- 1832 Asset Management
- Active Equity
- AEW
- Allianz
- Angelo Gordon
- American Century Investments
- Amundi Asset Management
- APG Asset Management
- Apollo Global Management
- Arcapita
- Ares Management
- Argo Investments
- Bain Capital
- BPEA
- BentallGreenOak
- BlackRock
- Blackstone
- BMO Asset Management
- Bridge Investment Group
- Brookfield Asset Management
- CapitaLand Investment
- Capital Group
- Carlyle Group
- CBRE Investment Management
- Cerberus Capital Management
- Ciputra Development
- CK Asset Holdings
- Cohen & Steers
- Commonwealth Superannuation Corp. (Investment Management)
- D&J China
- Daiwa Asset Management
- DFA Australia
- Dimensional Fund Advisors
- ENISO Partners
- ESR
- Fidelity International
- Fideuram Asset Management
- Gaw Capital Partners
- Geode Capital Management
- GIC
- GLP
- Greenwillow Capital Management
- Hongkong Land Holdings
- Horizon Kinetics Asset Management
- J.P. Morgan Asset Management
- Keppel Capital
- KKR
- KRA Capital Management
- La Banque Postale Asset Management
- Legal & General Investment Management
- Lion Global Investors
- Lone Star Funds
- Macquarie Asset Management
- Manulife Investment Management
- Massachusetts Financial Services
- Mintus
- Newton Investment Management
- Norges Bank Investment Management
- Northern Trust Investments
- Oaktree Capital Management
- PAG
- PGGM Vermogensbeheer
- PGIM Real Estate
- PineBridge Investments
- Primantara Utama Sejahtera
- Principal Asset Management
- RBC Global Asset Management
- Rockpoint Group
- Royal London Asset Management
- Schroders
- Simon Property Group
- Sinarmas Land
- SSgA Funds Management
- Starwood Capital Group
- Sunter Agung
- UBS Asset Management
- TD Asset Management
- Temasek Holdings
- Tishman Speyer
- TMB Asset Management
- Tokyo Century
- Triple Five Group
- Vanguard Group
- Wellington Management
3. Consultants, development and funding managers to the property development industry
- Asia Pacific Real Assets Association
- Association of Indonesian Real Estate Companies
- BCG
- Deloitte
- International Council of Shopping Centers
- International Housing Association (IHA)
- International Real Estate Federation (FIABCI)
- KPMG
- MAPIC
- McKinsey & Company
- PWC
- Real Estate & Housing Developers’ Association (REHDA) Malaysia
- Real Estate Indonesia (REI)
- Vingroup
6.6 The Big Picture
- Turning Shopping Centers into a Holistic Experience:
- Trend:
- Incorporating comprehensive services, amenities, convenience, facilities, logistics, merchandise, and products.
- Theme:
- Experiential shopping with a specialty in diverse segments.
- Demand:
- Satisfy physical, social, cultural, community, intellectual, medical, spiritual, and psychological needs.
- Market:
- Design and layout based on demographic profile.
- Size:
- Niche segments include mini to a mega community center that serves from 30,000 to 73 million visitors/year.
- Outdoor:
- Incorporating theme parks, outdoor landscaped space, sports centres, and open markets will be the major features. The future trend will be over 50% area dedicated to outdoor spaces.
- Logistics:
- Outer ring road to service multistorey car parking. Separation of vehicle and pedestrian movement. Mass transit rail and monorail for large and rapid movement of people. Home delivery service upon completion of shopping.
- Operation:
- 24/7
7.0 Management Team
7.1 Key Management Team
- Mentors: Visionary pioneers and industry leaders with an extensive global network providing invaluable guidance and inspiration.
- Coaches: Mission-oriented industry experts offering practical solutions to challenges, ensuring the team stays focused on its objectives.
- Partners:
- A project leadership group with a successful track record in the development, operation, and financial management of the property industry.
- Reputable investment manager with access to funding sources in the property industry.
- International property groups.
- A reputable local property group with procurement capabilities, a local network, sound financial status, and solid government support.
In the property industry, several global leaders have made significant contributions, shaping its growth and success. Here is a list of some of these remarkable individuals, honoured for their vision and dedication:
These are just a few of the outstanding professionals and captains of the industry. The readers are encouraged to explore further and conduct their research to learn more about the management teams in this dynamic field.
7.2 Key Management Team Model
8.0 Unique Business Model
8.1 Successful Track Record
- Team:
- The international and domestic key players in the property industry have visions, successful track records, a global network, and command trust in the industry.
8.2 Entry Model
- New:
- Site locations to be near mass transit rail and public transport. Engage the local developer in the procurement of the best location.
- Investors:
- Mixed-use development combines residential, shopping centres with social, community, physical, and other needs for the target segments.
- Entity:
- Joint venture partnership with investors, developers, and operators team.
8.3 Unique Business Model
- Team:
- Joint partnership with established property groups.
- Target:
- Strategic alliance with target market segments to secure customers.
- Integrate:
- Integration with other social, community, entertainment, and other attractions will offer comprehensive services and products.
9.0 Key Success Factors & Risk Mitigation
9.1 Key Success Factors
- Team:
- A strong team with a proven successful track record.
- Vision:
- A vision that sets the trend for the future habitat and interaction of residents and their environment.
9.2 Risk
- Economic:
- Lack of funds, buyers, and economic downturn is the risk associated with property development.
- Political:
- Political instability, changes in regulations, limited growth, and long-term financial income are the fears confronting foreign investors.
- ESG:
- Foreign property developers are also concerned with labour productivity, cultural conflict transparency, technology, and management issues.
9.3 Risk Mitigation
- Support:
- Support from government agencies on the procurement of the dwellings for public servants.
- Demand:
- Further demand creation through investment will spur economic activities.
- PPP:
- Public-Private Partnership model will prompt the government to establish policies that will reinforce the bankability of the residential project.
- ESG:
- Established skill assessment, training programs, and ESG policies will enhance transparency and productivity.
10.0 Exit Strategy
10.1 Forms of Exit
- IPO, buy-out, M & A, and transfer.
10.2 Key Attractions for New Investors
- Portfolio:
- Property projects provide investment opportunities in the emerging market.
- Revenue:
- Long term revenue retail projects.
- Demand:
- Secure target market.
- Team:
- Solid management team with successful track records.